
Bitcoin recently retested the psychological resistance at $12,000 before declining to $11,400 level. While Bitcoin takes the time to gather strength for the next retest, some altcoins have managed to gather steam. BSV steadily declined over the past few days and maybe poised for another drop. Cosmos has performed remarkably well over the past week and could continue the trend while BAT exhibited range-bound price action.
Bitcoin SV [BSV]
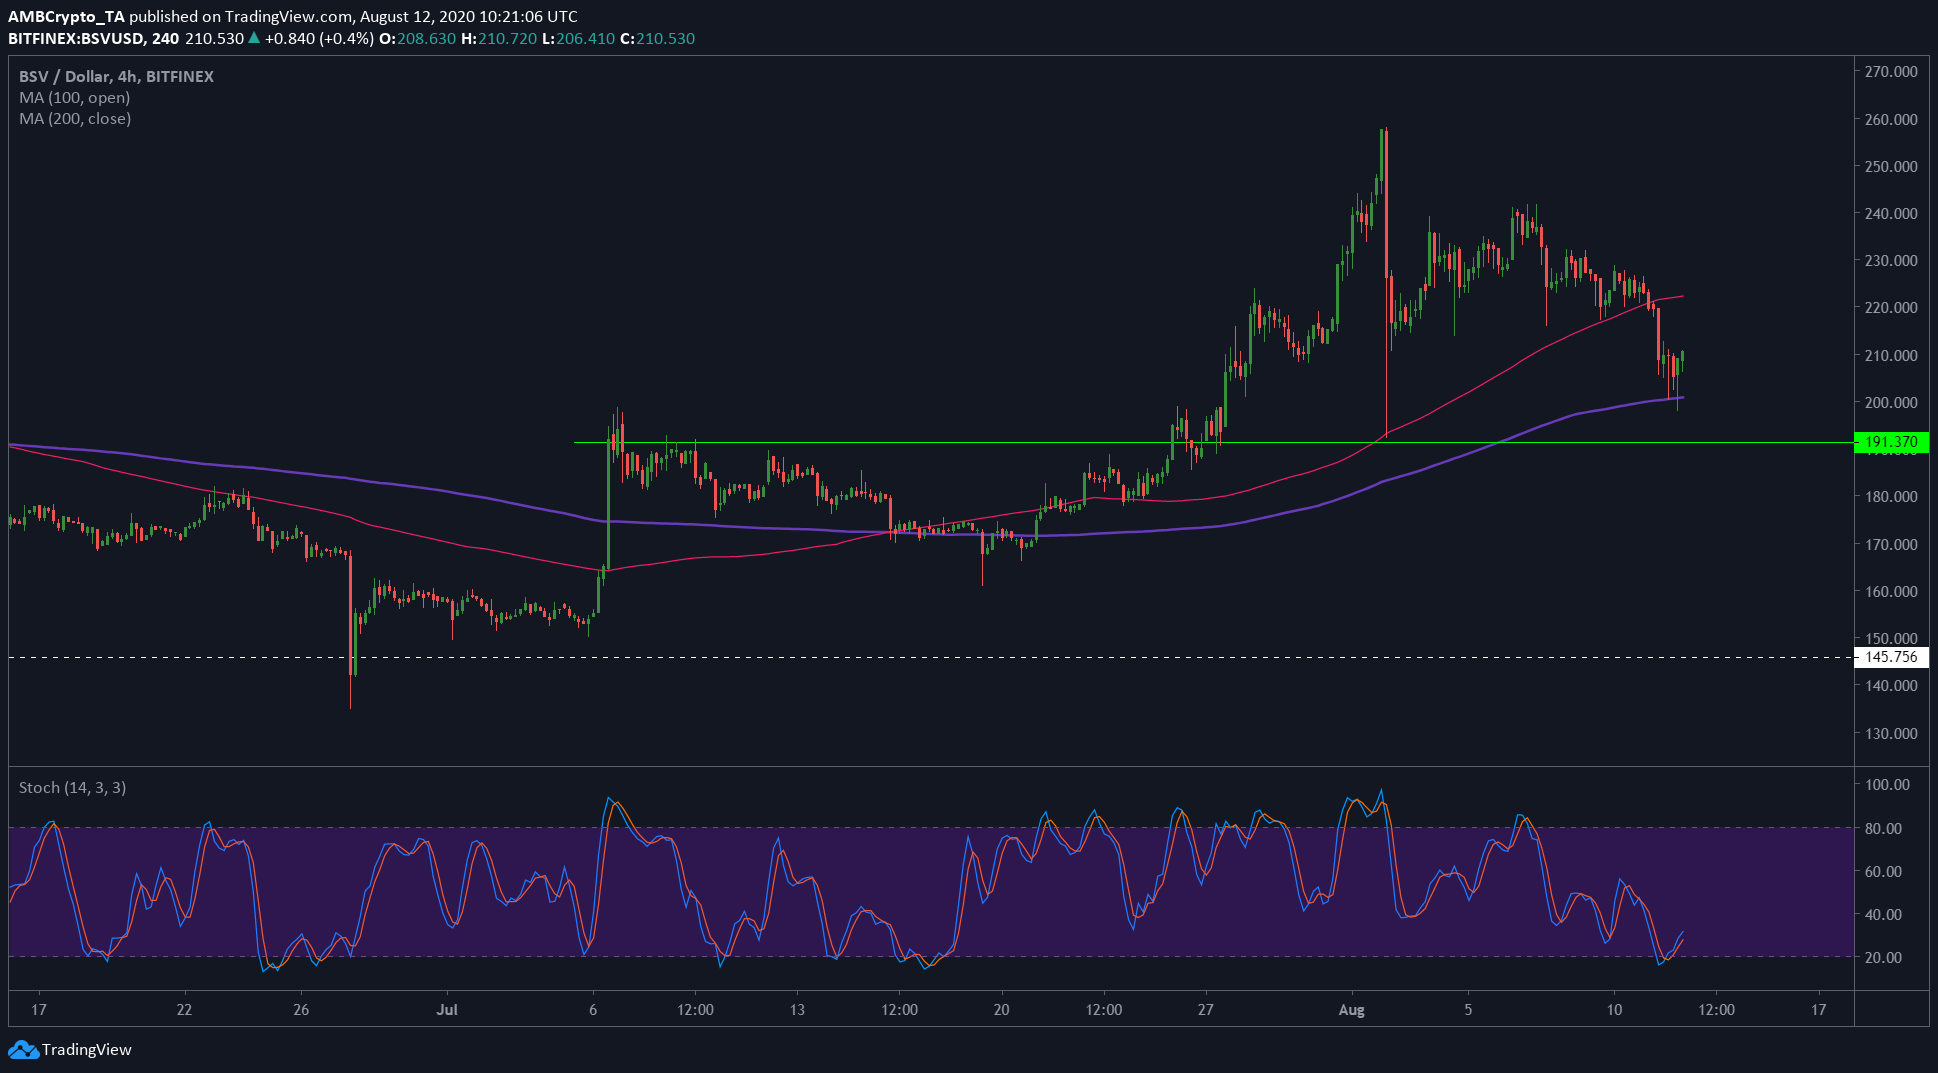
Source: BSV/USD on TradingView
BSV had a market cap of $3.82 billion and held the 7th spot on CoinMarketCap’s list. BSV was trading below 100 EMA (pink) and at 200 EMA (purple), with the next strong support near $190. Stochastic indicator formed a buy signal, but BSV failed to register a higher high candle since the positive crossover. This would likely indicate downside potential for the coin unless buyers can step in at 200 EMA support to effect a reversal.
Cosmos [ATOM]
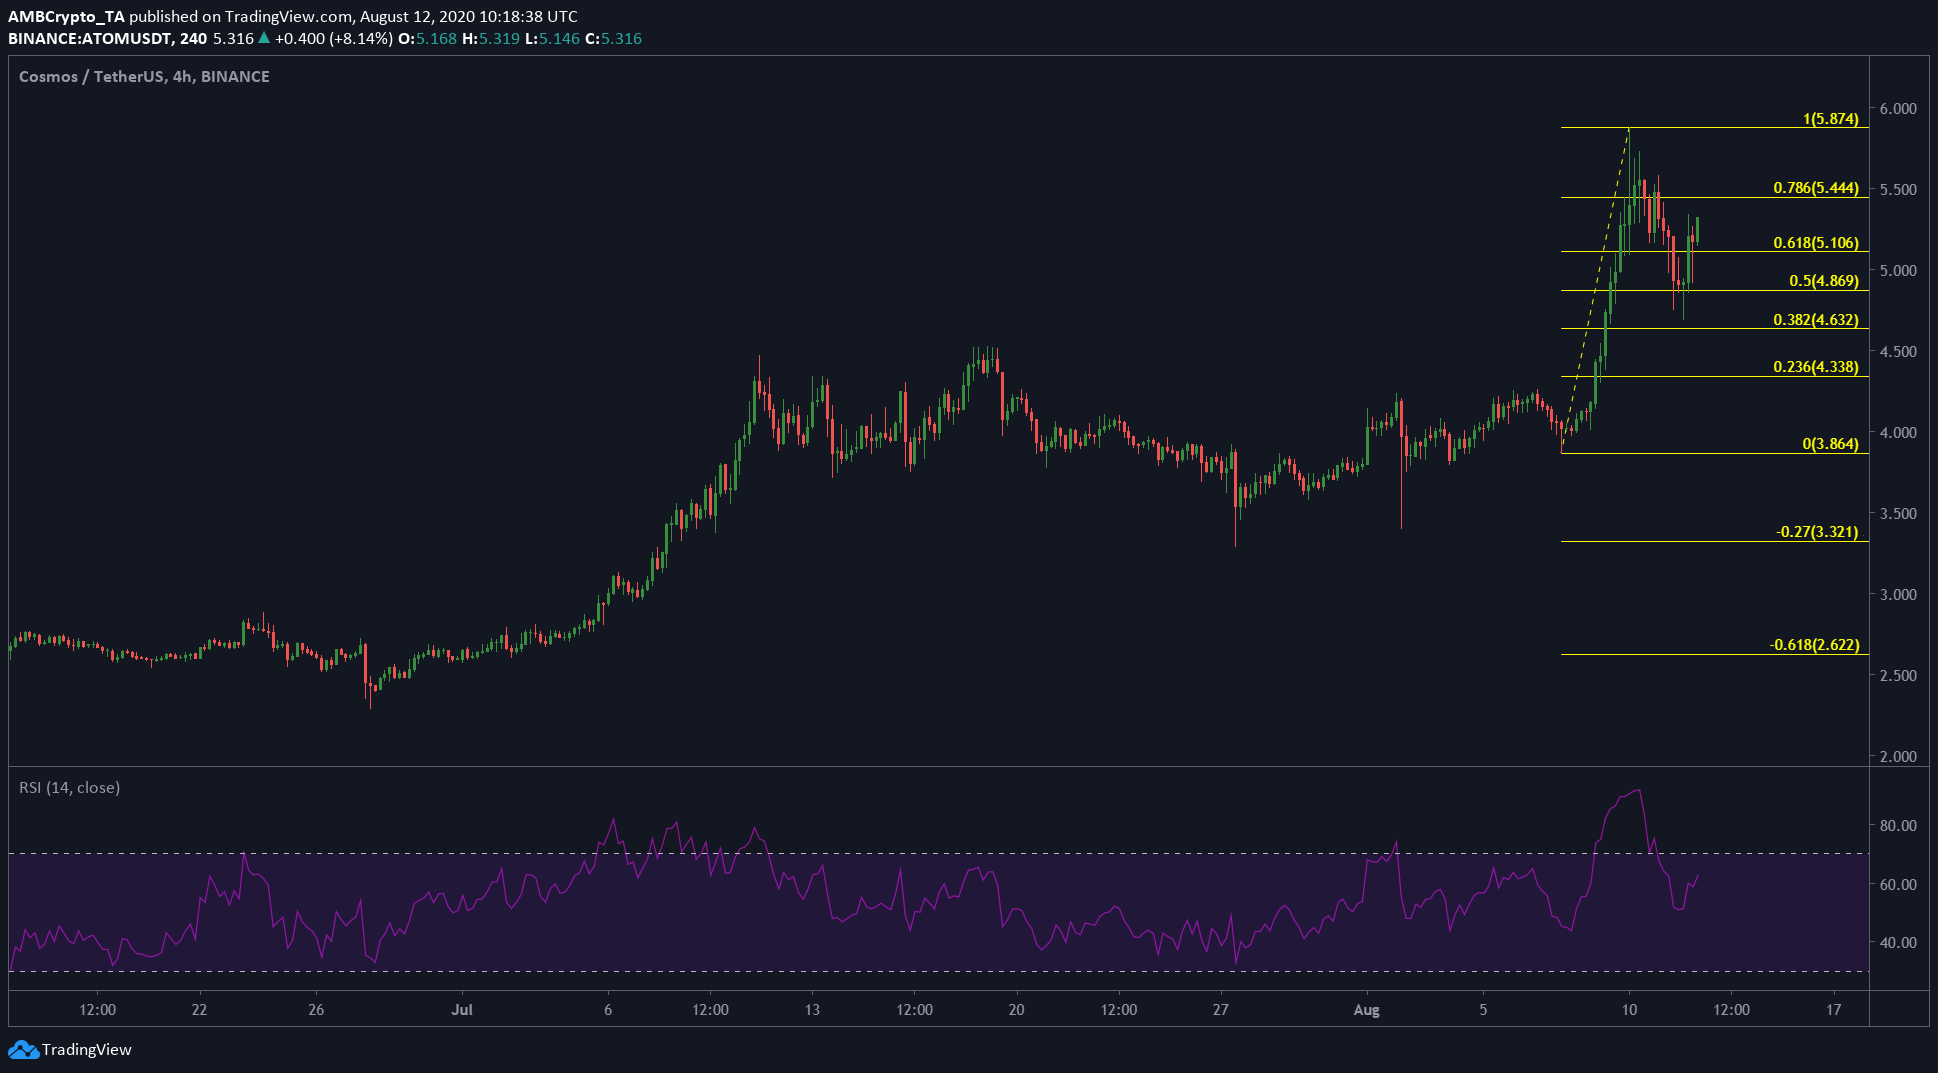
Source: ATOM/USDT on TradingView
Cosmos has performed well in 2020, breaking into the top 30 coins with a capitalization of $1.04 billion. Last month, Cosmos was revealed to be one of the companies behind the launch of Anchor, a decentralized finance platform aiming to provide passive income to users by way of yield farming.
Cosmos reversed its bearish outlook and gained more than 25% on breaking out of the range it was trading within for most of July. The coin saw a breakout and retracement to the 0.5 Fibonacci (yellow) level before going past the 0.618 level. RSI was at 62.4, which indicated a bullish potential. It is probable that the coin is likely to retrace its steps and hits new highs.
Basic Attention Token [BAT]
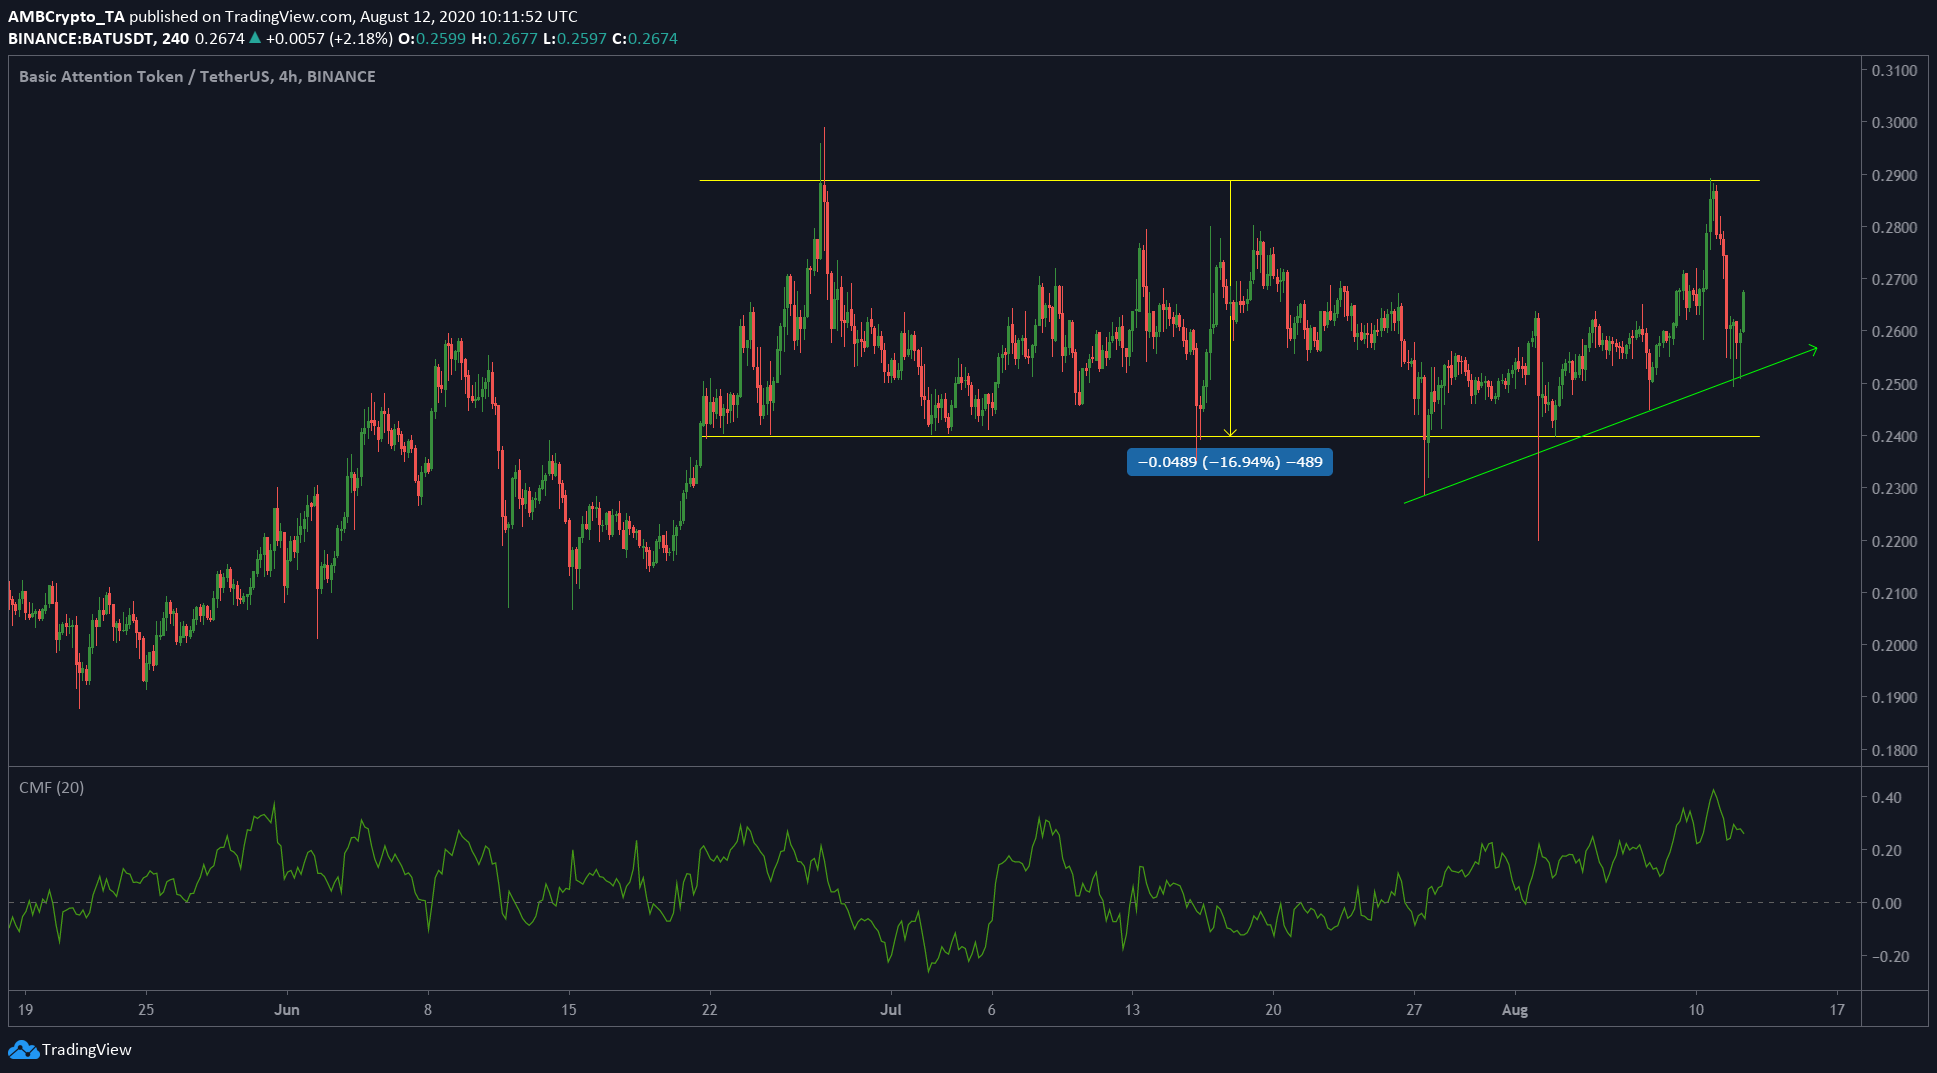
Source: BAT/USDT on TradingView
BAT has been gradually recovering since the market-wide crash in March and experienced some stagnation over the past few weeks. Ranking 38, with a market capitalization near $388.8 million.
BAT has been stuck in a range, with long wicks and tails out of the range. This action might continue till BAT can breach the highs, or lows, and stay there. CMF indicator showed money flowing into the market, and the past couple weeks saw an uptrend (yellow) as well.