
- BTC’s price hovered between key levels, with the 50-day and 200-day moving averages indicating a potential pivot point.
- Short-term holder activity suggested increased market liquidity, but heightens the risk of sharp price swings.
Bitcoin [BTC] is currently experiencing a notable rise in short-term holder (STH) supply, a trend that holds significant implications for its price action and market sentiment.
Alongside this, BTC has shown increasing volatility, prompting analysts and traders to reassess its short-term trajectory.
Bitcoin STH supply on the rise
The recent increase in the supply held by Bitcoin short-term holders (STHs) is illustrated in the analysis of the Long-Term Holder vs. Short-Term Holder Supply chart.
The orange section shows the steady growth of STH supply, which has historically signaled shifts in market sentiment.
As of January 2025, STH supply accounts for a more substantial percentage of BTC’s total circulating supply than it has in previous months.
This rise indicates that more Bitcoin is transitioning into the hands of shorter-term speculators or traders rather than remaining with long-term holders.
Such changes often precede periods of heightened volatility, as STHs are more likely to sell during rapid price swings, contributing to increased liquidity and movement in the market.

Source: CryptoQuant
Long-term holders, represented in purple, continue to dominate the supply, suggesting that BTC’s overall network fundamentals remain robust. However, the increase in STH supply may signal caution, as it reflects a potential uptick in speculative activity.
Current trends and key levels
Bitcoin’s price has entered a volatile phase, currently trading at $99,006.68, marking a 3.47% decline in the last 24 hours.
The recent pullback has brought BTC below the 50-day moving average (MA), which is positioned at $98,889.02, while the 200-day MA remained significantly lower at $76,664.32.
This positioning suggests that BTC still holds a bullish long-term trend, but the break below the 50-day MA introduces short-term caution.
The Accumulation/Distribution (A/D) indicator, currently at 5.04 million, shows a slight downturn.
This indicates that distribution activity has picked up as traders and investors take profits at higher levels, aligning with the recent price drop.
A continued decline in A/D could signal further selling pressure, while stabilization might hint at renewed accumulation.
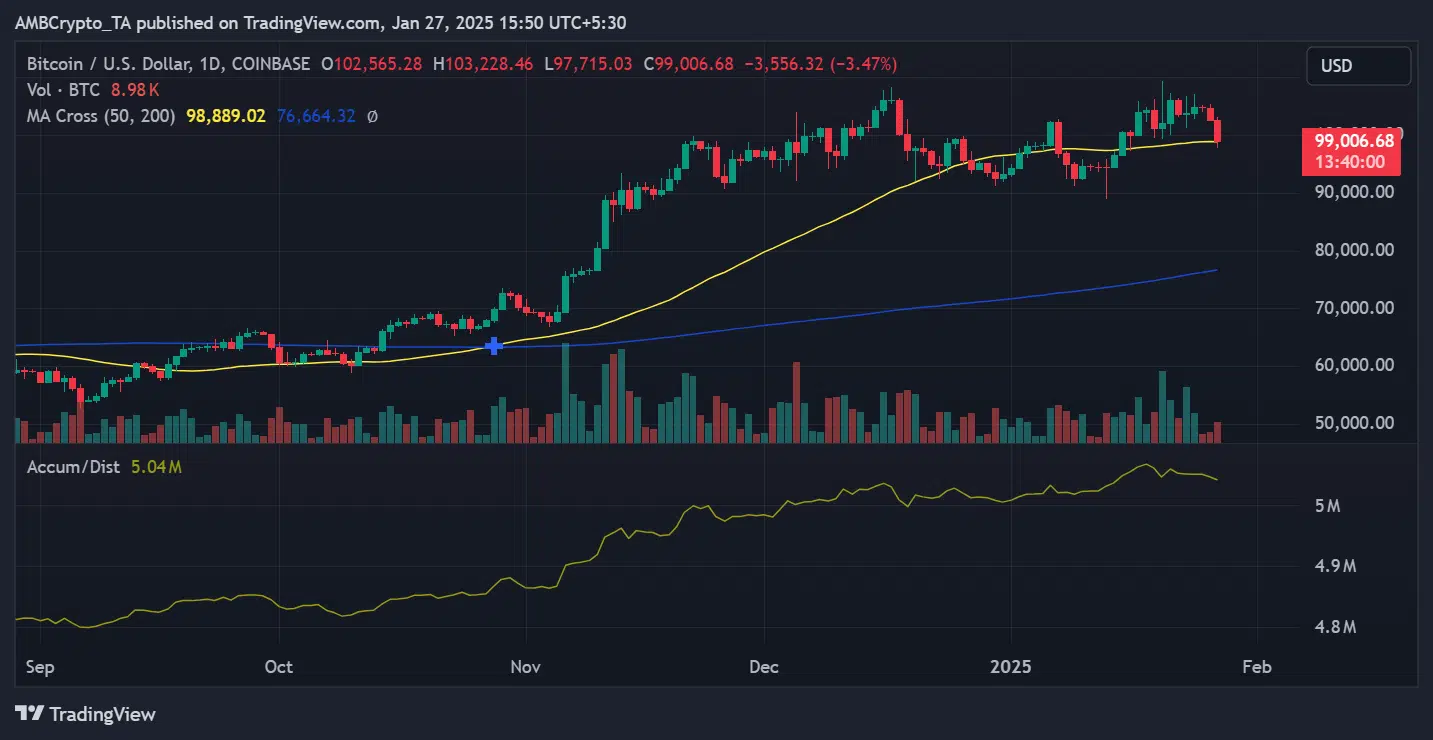
Source: TradingView
In terms of key support and resistance, Bitcoin’s nearest support lies at $97,000, a psychological level that aligns with previous demand zones.
On the upside, $102,000 remains the first hurdle for BTC to reclaim its recent bullish momentum. If it fails to hold the $97,000 support, the price could test the 200-day MA around $76,600.
This analysis reflects Bitcoin’s shifting dynamics as short-term holder activity increases, introducing volatility into an otherwise robust long-term bullish trend.
Implications of short-term holder activity on BTC
The growing influence of short-term holders introduces both risks and opportunities for Bitcoin’s price.
Historically, elevated STH supply has led to increased market liquidity, enabling sharp price movements. While this creates opportunities for active traders, it also heightens short-term sell-off risk.
For long-term investors, the rise in BTC STH activity may signify a temporary phase of market speculation.
Bitcoin’s long-term fundamentals, as evidenced by the sustained dominance of long-term holders, remain strong, suggesting that any volatility may be transient.
Read Bitcoin’s [BTC] Price Prediction 2025-26
The market’s next direction will likely depend on how short-term holders react to key psychological levels, such as $30,000.
A breakdown below this level could trigger further selling, while a recovery above $32,000 would likely attract fresh buying interest.