Bitcoin sideways movement could breakout to $8500 in January

Since November 20, Bitcoin has been consolidating between the $7000 and $7500 levels, with intermittent pumps to $7800 and dips under $6500. Despite relatively poor performance over the last month, there is still hope for BTC as December leads us into the new year.

Source: CoinStats
Bitcoin 1-day chart

Source: BTCUSD on TradingView
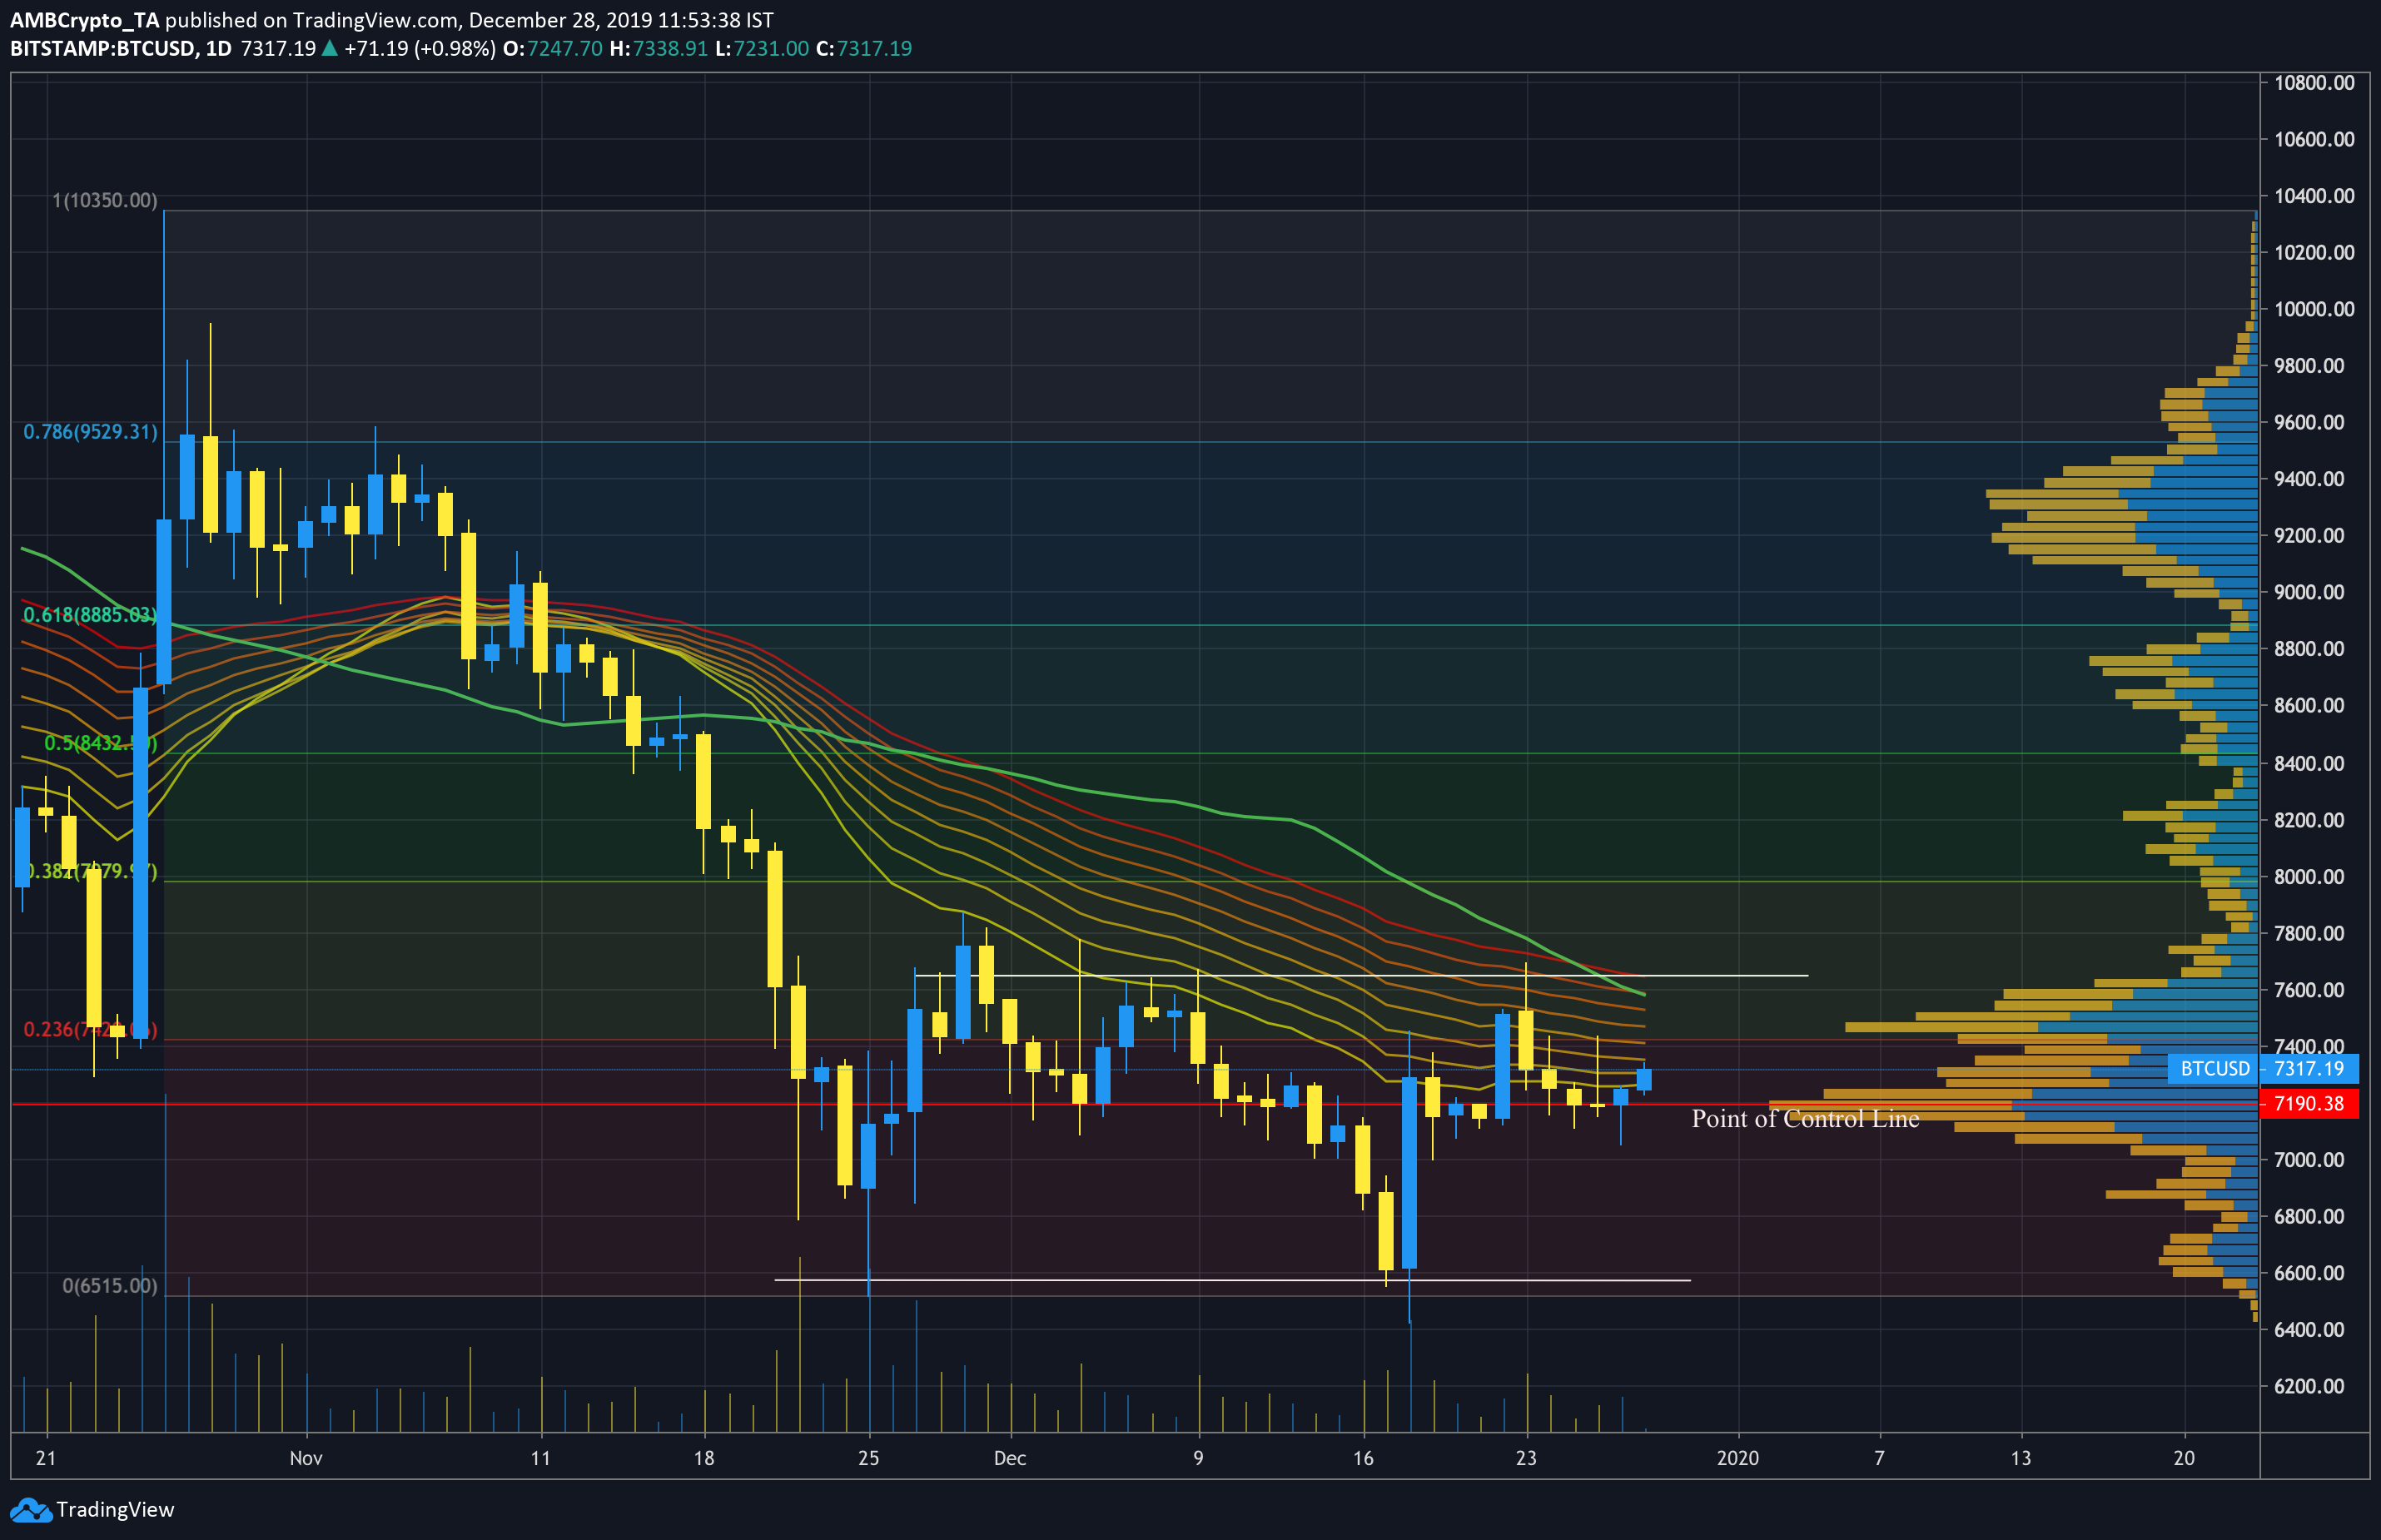
Bitcoin’s daily chart showed BTC entering a rectangle bottom formation a few days ago, shuttling between the two trend lines since. As expected, the pattern is accompanied by a decreasing volume trend, with mild peaks in volume as the price approaches the pattern boundaries.
BTC looks to be testing the Point of Control line on the Volume Profile indicator, and a push up to the next high volume node seems plausible, although a move down could also occur. Fortunately, rectangle bottoms break out upward nearly 60% of the time, making a move down in price slightly less likely.
Further, the 50-day moving average looks to be dipping, following poor performance in BTC price action over the last few days. Despite looming over the price line, a typical sign of a bearish market, this leaves an opportunity for Bitcoin to move up, and cross over the moving average into a more typically bullish scenario.
Bitcoin price also almost managed to cross above the EMA Ribbon lines on December 23, and as the lines looked to be converging slightly, Bitcoin could rise above the mean reversion that may be yet to come. The next major level of resistance will undoubtedly be at the 23.6% Fibonacci retracement line, at around $7450. Also, Bitcoin volatility is at its lowest point since September, making large price swings less likely in the short-term.
Bitcoin Daily Chart (2018)

Source: BTCUSD on TradingView
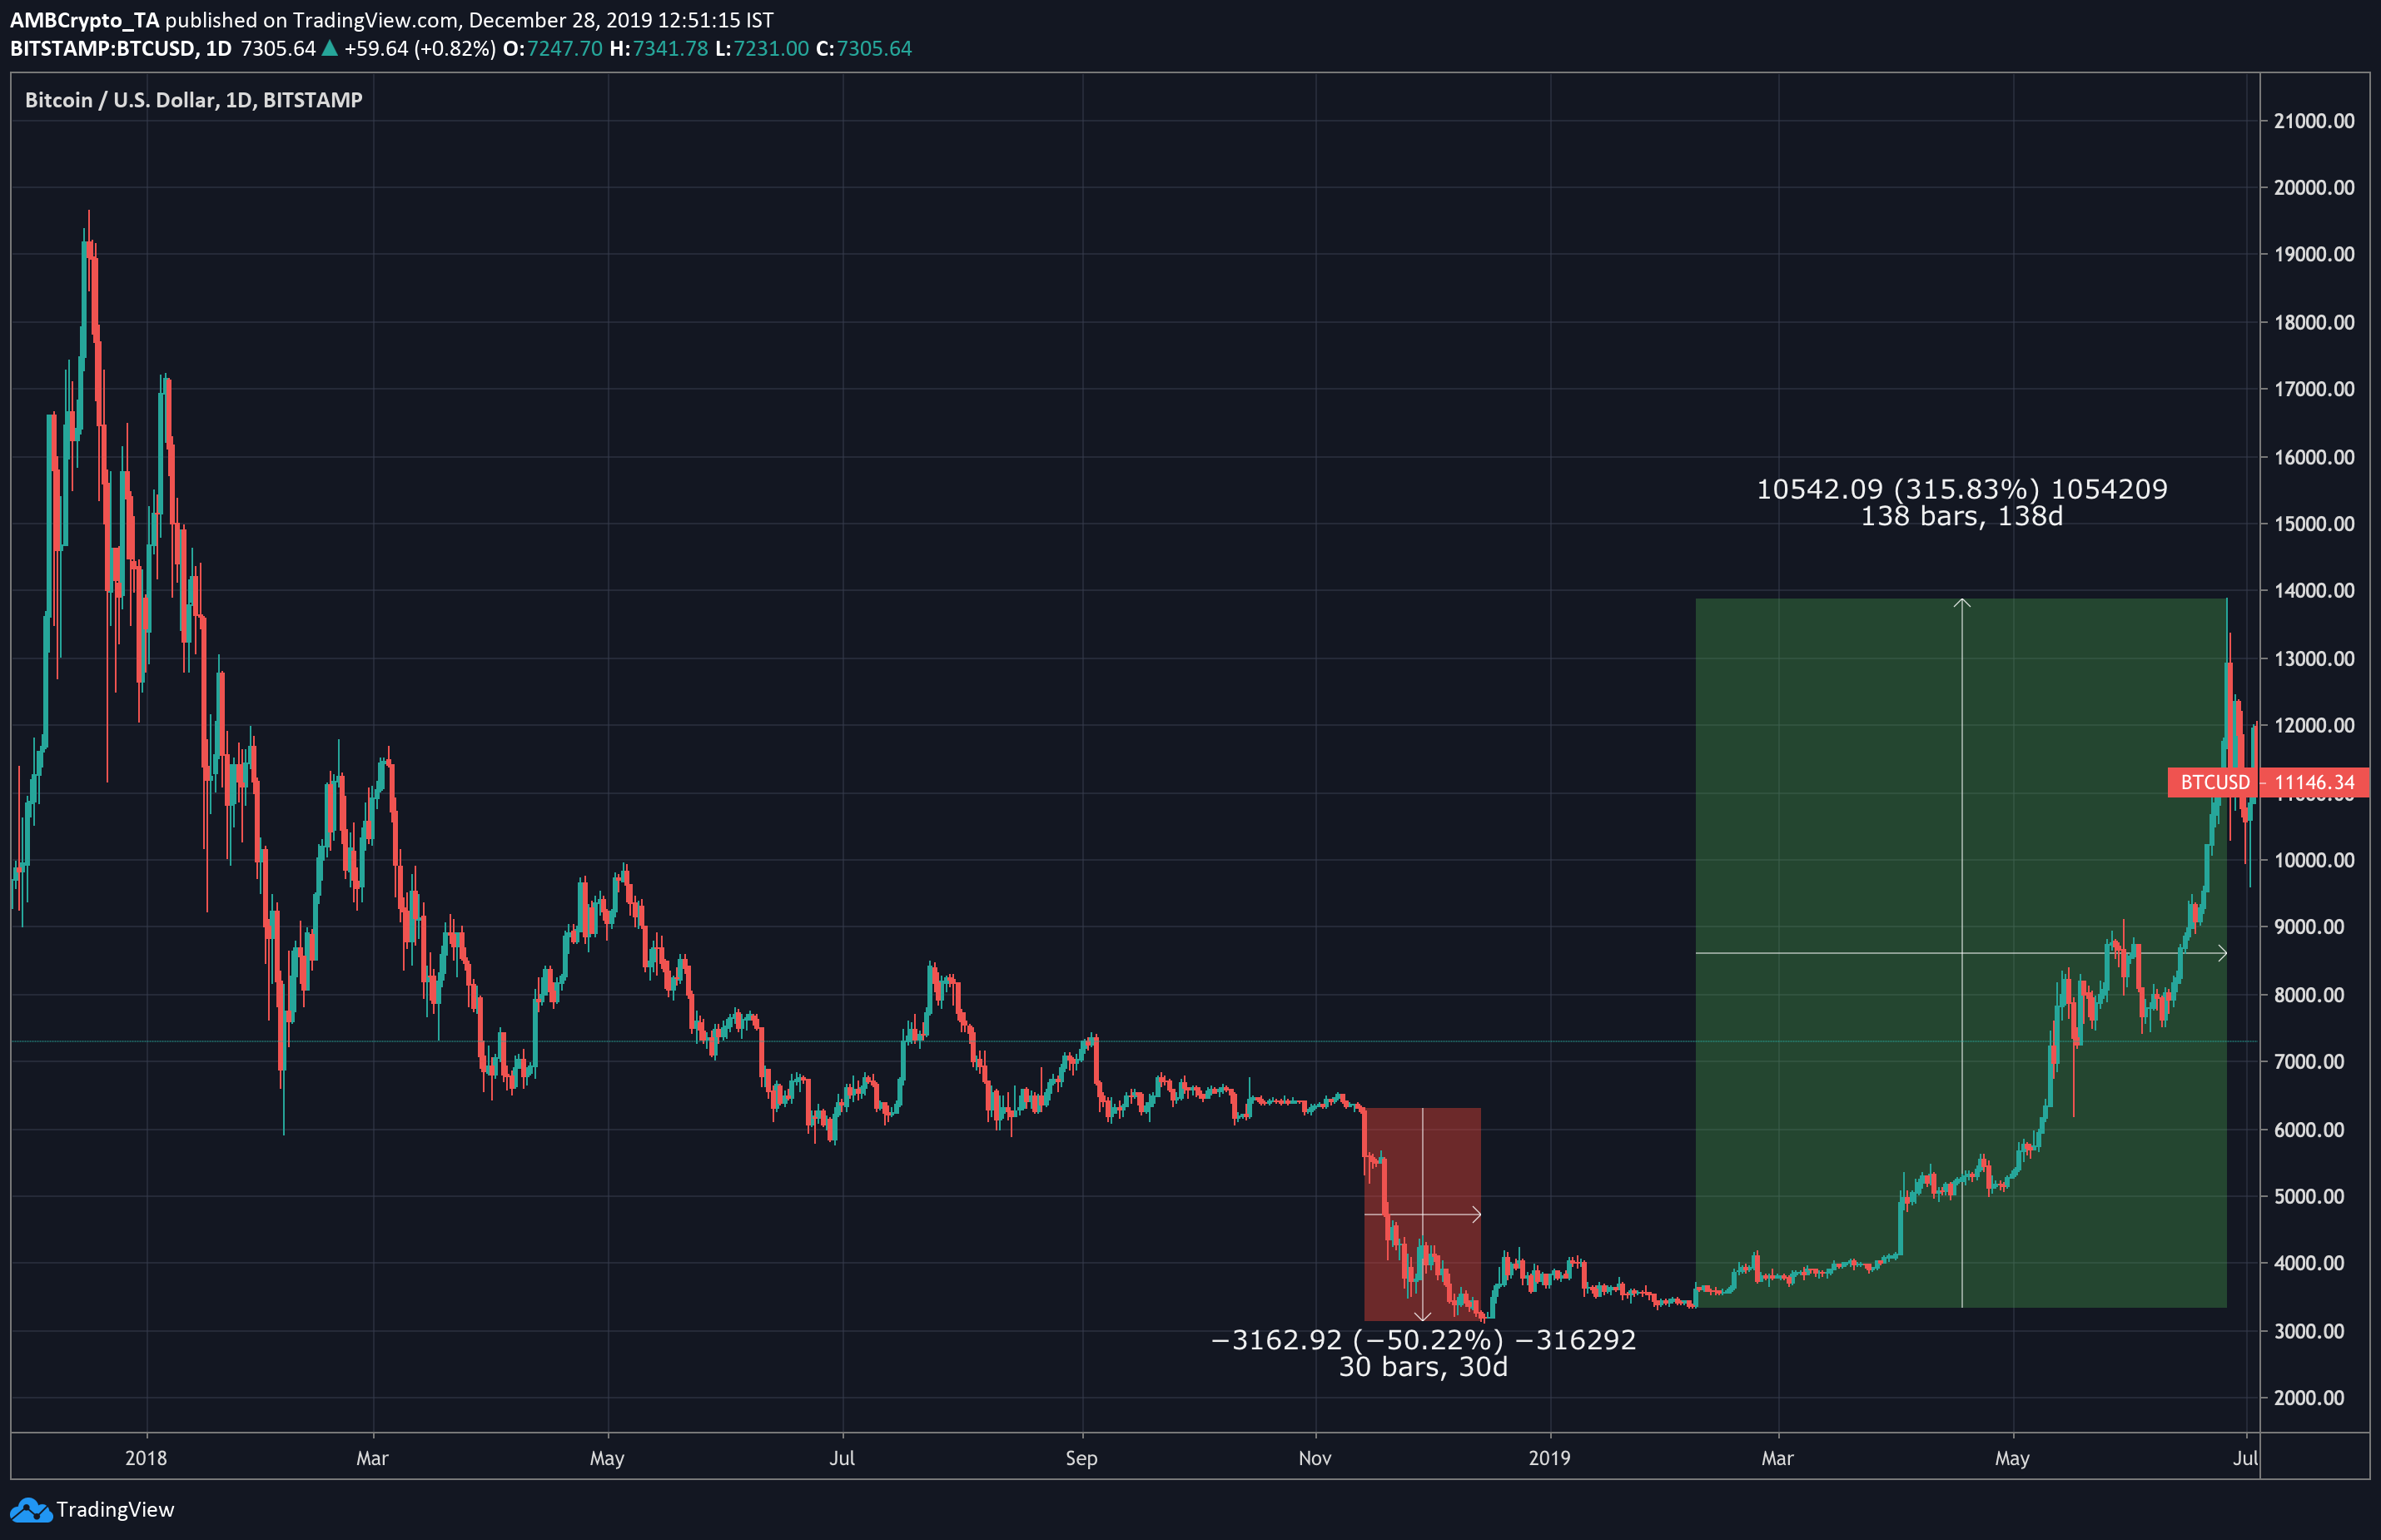
Bitcoin had spent most of 2018 above the $6500 mark, before it dipped to around $3000 mid-December. BTC spent the next few months consolidating between $3300 and $4000, before slowly recovering through a bull run to over $13,800. If historical data is any indicator, Bitcoin will likely make a slow rise to higher levels as we cross into the new year.
Conclusion
Sideways movement over the next couple of weeks seems highly probable, and a downward-facing breakout, though doubtful, could see BTC dipping under $7000 in the next couple of weeks. The more likely scenario given indicators and past performance, is that BTC will rise above the pattern boundary to $8500 in the same time frame.


