Bitcoin
Bitcoin short-term price analysis: 18 June

Disclaimer: The following price-prediction should materialize in the next 36-48 hours.
After 11th June, Bitcoin was freed from its struggles with the $10k resistance but rather than taking a positive turn, the asset ended up having a scuffle with resistance at $9550. At press time, Bitcoin was valued right below at $9412 with a trading volume of approx $20 billion in the past 24-hours.
Bitcoin 1-hour chart

BTC/USD on Trading View
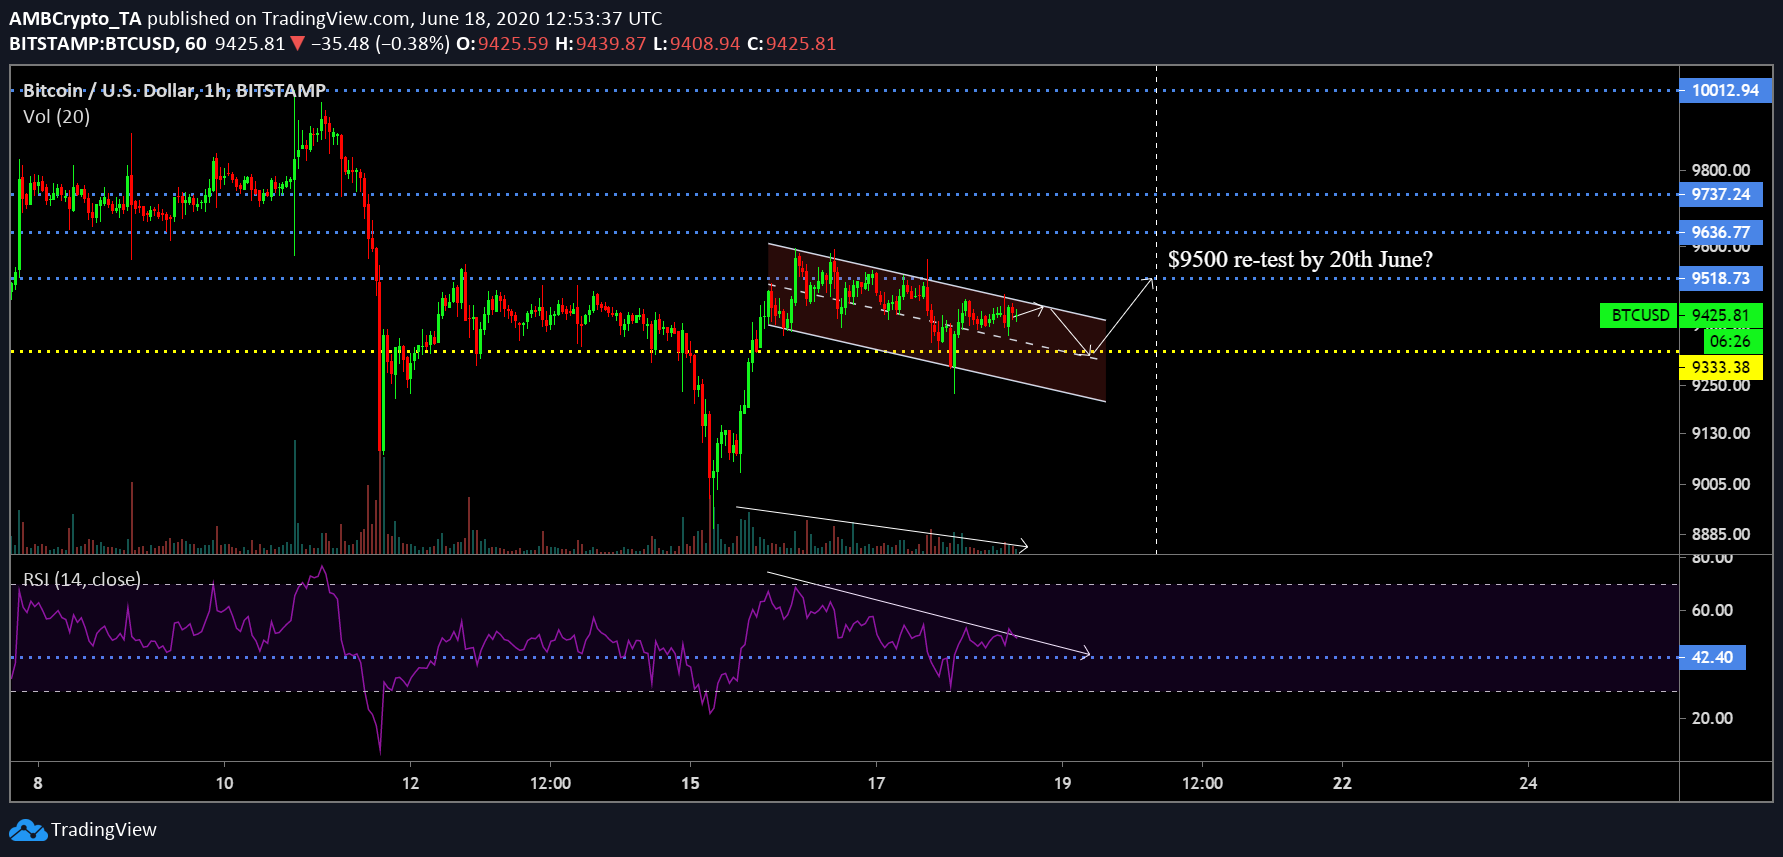
At the time of writing, Bitcoin’s price is currently moving between the trendlines of a descending channel in the one-hour chart. Although the market sentiment has been clearly bearish over the past few days, the possibility of a bullish breakout was there for the asset. The asset might face another retracement down to support at $9333 but a quick surge might see Bitcoin re-test resistance at $9518 by June 20th.
Market trading volume has been declining since June 15th, which is a positive sign considering the price depleted a little in terms of valuation as well. Low trading volume with declining price exhibits a higher chance of a bullish breakout.
Relative Strength Index or RSI continues to remain on neutral grounds but buying pressure may establish dominance after dropping down to 42.40 in the charts.
Bitcoin 4-hour chart; another $10k march?
BTC/USD on Trading View
Besides aiming at short-term objectives, Bitcoin’s 4-hour chart suggested the possibility of another $10 re-test on the horizon. As observed in the charts, a distinct inverse head & shoulder pattern might attain completion over the next few days, upon which the chances for a bullish breakout improves.
The breakout period might coincide with the 1-hour chart, as the upwards movement could possibly occur in the last week of June. Based on historical breakouts, inverse Head & Shoulder patterns have often demonstrated huge turnarounds for Bitcoin.
However, an immediate hurdle remains at $9484 as VPVR suggested the position of strong Line-of-Control(red line) at the aforementioned price point. Any move above this point will increase the chances of Bitcoin facilitating another attempt at re-testing $10,000 but the completion of the pattern remains necessary.
Conclusion
Bitcoin will possibly re-test $9500 within the next 36 hours and following that the chances will improve for Bitcoin to re-test resistance at $10k by the end of June.

