Analysis
Bitcoin, Ontology, Dogecoin Price Analysis: 12 September

Bitcoin was trading beneath its $10,400 resistance level, at press time. If it manages to reclaim the level as support, it could surge north to $11,200, dragging with it the rest of the market. Further, while Ontology’s demand surged on the back of earning WING tokens, Dogecoin showed signs of bearishness and looked to be headed towards another drop in value.
Bitcoin [BTC]

Source: BTC/USD on TradingView
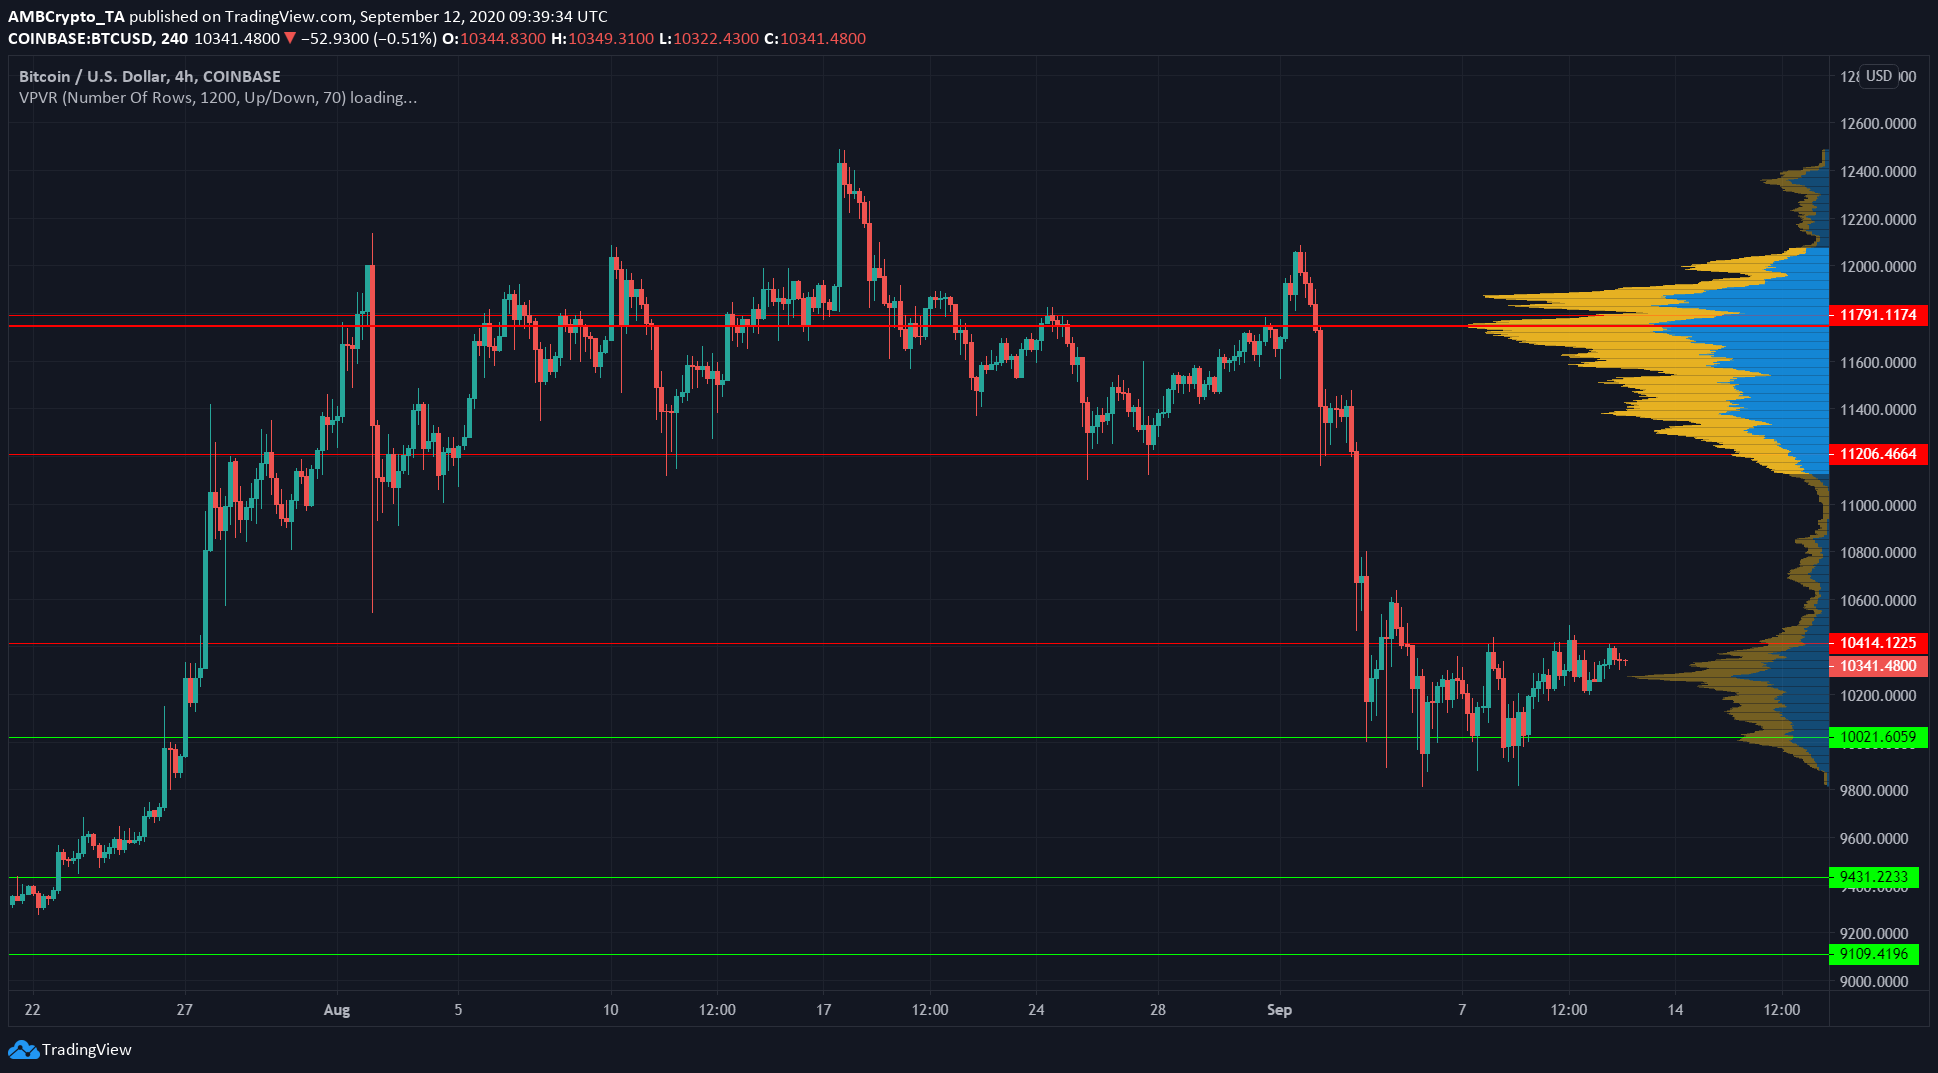
Bitcoin was trading at $10,341, at press time, and just under the resistance level at $10,400. The Volume Profile Visible Range showed that if BTC reclaimed level $10,400, it could quickly slingshot upwards to $11,200 as there was not much trading activity in this zone recently.
The Point of Control for Bitcoin, as highlighted by the VPVR, was at $11,745. Over the past month, $11,800 has been an important level, as BTC used this level as a springboard to climb past $12,000 last time.
$10,200 can also serve as an important support level, while $10,000 has been defended strongly so far by BTC.
If successive trading sessions close above $10,400 for BTC, it could lead to buyers stepping in after a close above its resistance level.
Ontology [ONT]
Source: ONT/USD on TradingView
Ontology was making strong gains as it sailed past its resistance zones. At the time of writing, it was trading at $0.84, having met some resistance around the $0.85-zone.
Further, the DMI showed that a strong uptrend was in progress. The ADX (yellow) was well above 20, while the +DMI (blue) was also above -DMI (pink).
The developers of Ontology have always touted Ontology as a high throughput blockchain. Last week, Wing, a DeFi platform based on Ontology, released its whitepaper. For the same, tokens worth $67.99 million had been deposited in the Wing Flashpool, at press time, to earn WING tokens.
Dogecoin [DOGE]
Source: DOGE/USDT on TradingView
DOGE showed hidden bearish divergence as its price made lower highs, while the RSI (momentum indicator) registered higher highs on the charts. This was highlighted by the white trendline as well, with the RSI showing a neutral value of 50.
DOGE had dropped past its support level at $0.0032 and was trading at $0.0027, at the time of writing.
Such bearish divergence could prompt DOGE to drop further on the charts to find support around the $0.0026 level.

