Bitcoin Double Dips: King Coin marks second descent below 100 day EMA; consolidation failure?

Pardon me, may I double-dip in the bearish sauce?
Bitcoin, after flirting with $10,000 for several months has finally made a move. Unfortunately for the romantics in the market, that move points to the red of rejection rather than the green of getting somewhere.
On September 12, the king coin yet again dipped below its 100-day moving average, failing to consolidate following its revival from the earlier slip during the close of August. In the past when Bitcoin trudged below this key level of market health, a move upward meant a sign of sustenance, rather than temporary revival, as the current case is proving to be.
Following its move out of fifth heaven and into a four-figure mark on 28 August, Bitcoin slipped below its 100-day moving average for the first time since February 2019, when the price was under $4,000. However, this wrong was wiped clean with 5 consecutive green candlesticks taking the price up by 11.88 percent up to $10,600, but a slew of sluggish days resulted in the dreaded line moving above the king coin’s price yet again, as a failure of consolidation might prove fatal for the cryptocurrency.
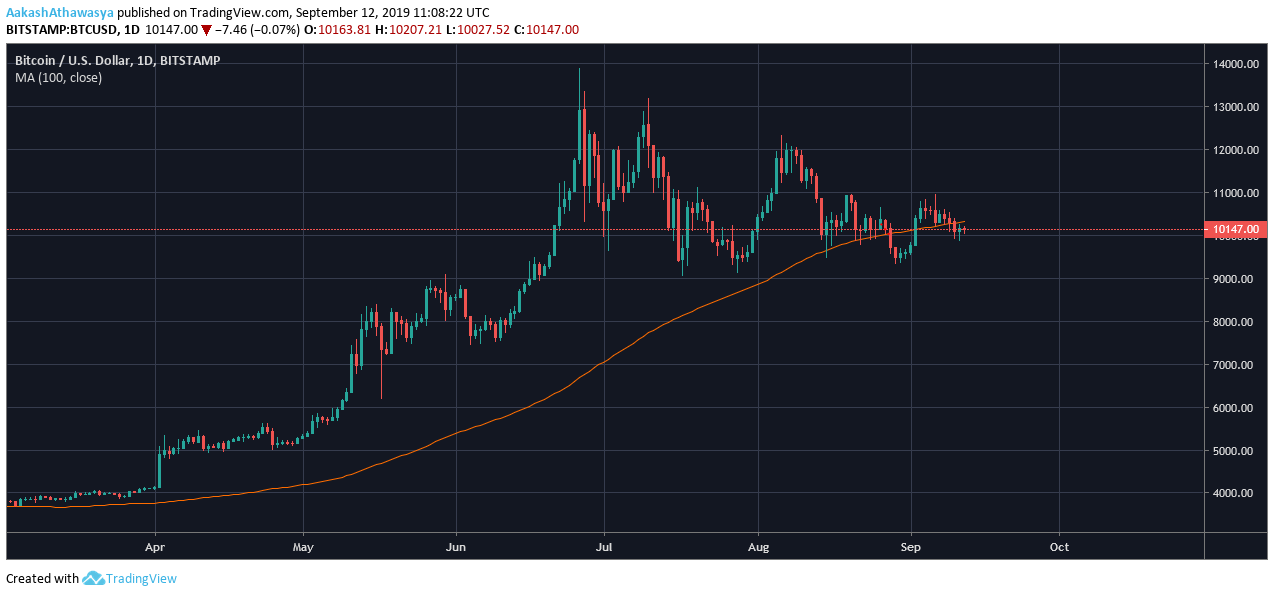
Source: Trading View
This yo-yo-ed movement with the 100-day MA can be likened to a similar pattern exactly a year ago. Back in August – September 2018, when the news of a crypto-dedicated Goldman Sachs trading desk was making the rounds and the crypto-winter was in full swing, Bitcoin soared over the 100-day moving average during the close of August 2018, and fell back down, owing to a 15.98 percent price fall in 4 days.
All-in-all, Bitcoin took a total of 5 months and 13 days to move out from the shadow of the 100-day MA. This period was marked as the peak of crypto-winter, as the price fell by over 55 percent till the close of the year. In December 2018, when Bitcoin was trading at just above $3,000 and the collective market cap was just over $105 billion, the difference between the BTC price and its 100-day MA, at the time, was around $2,400.
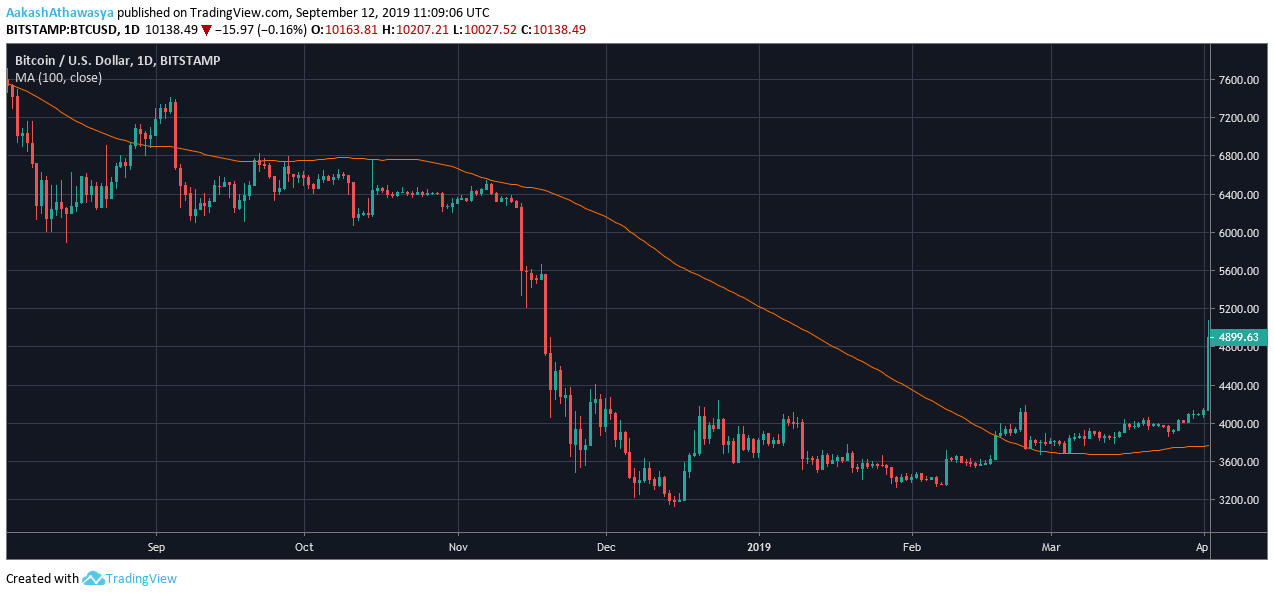
Source: Trading View
On the upside (the quite literal upside) of trading above the 100-day Moving Average, since moving above, in February 2019, the price has shot up by 160 percent. Within the same period, Bitcoin entered its Golden Cross, broke past the $10,000 mark, even added over $3,500 to the five-figure mark, and saw waves of institutional adoption.
Although from a year-to-date perspective, the price of Bitcoin is performing better than many would have expected, over the past few months, the slump has cemented. Since breaking past the $5,000 mark in April, the king coin managed to add another $5,000 in the next few months, and by mid-June 2018, the price topped out at $13,500. Following this ascent, the price has since not surged over the ceiling, dropping below the $10,000 mark several times. This slump below the 100 day MA, if not corrected soon, could result in a prolonged bearish move.