Analysis
Bitcoin Cash, Tron, Zcash Price Analysis: 08 December

Ethereum has been trading just beneath the $600 mark over the past few days. This sideways movement was reflected in the altcoin markets as well. Bitcoin Cash and Tron traded with very little vertical momentum on the charts in the past week. Zcash did not see good buying volume even as it defended a level of support.
Bitcoin Cash [BCH]

Source: BCH/USDT on TradingView
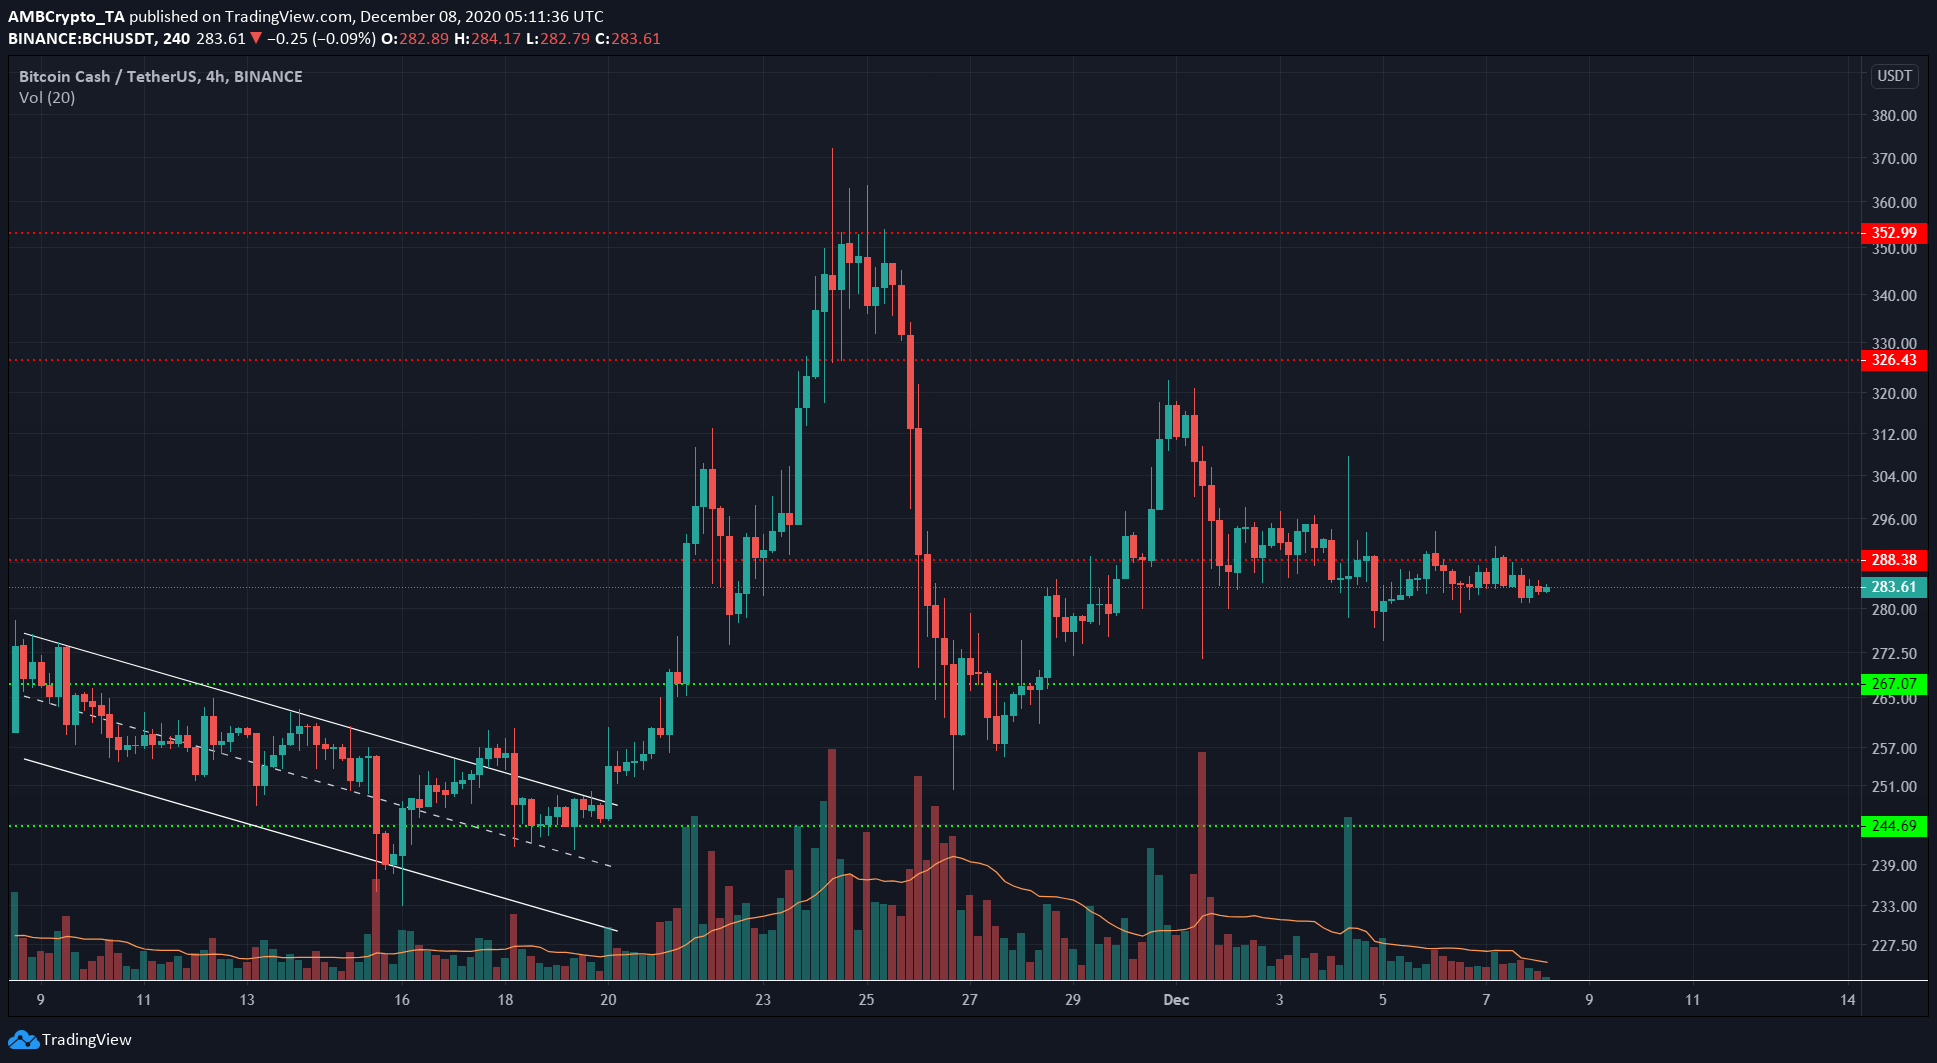
Bitcoin Cash had very little momentum behind it in the past few days. The trading volume has also been low, and traders seemed to be waiting for the market to decide the direction.
A breakout to the upside would need a candle close above $295, while a close below $274 might signal that support at $267 was also likely to be broken.
The $288 level has been flipped to resistance, and bulls would need to drive the price to the psychological $300 level in order to subdue the selling pressure from bears.
Tron [TRX]
Source: TRX/USDT on TradingView
Tron also experienced only sideways movement over the past few days, alongside Etheruem. The price has held above the $0.03 support for the most part.
The 20 SMA (white) and 50 SMA (yellow) crisscrossed one another and in general, moved closer together to reflect the lack of upward or downward momentum for TRX.
The Bollinger bands were also tight around the price to further highlight the lowered volatility of TRX.
Zcash [ZEC]
Source: ZEC/USDT on TradingView
ZEC formed a symmetrical triangle after trending upward previously. The price has stayed above $71 support in recent days, but the OBV showed no spike in buying volume.
The selling volume has been strong while buying volume has been feeble over the past couple of weeks
The triangle pattern generally sees a breakout that follows the previous trend. Hence, a candle close outside the pattern on strong trading volume will indicate the direction of the next move.

