Analysis
Bitcoin Cash short-term Price Analysis: 11 November
Disclaimer: The findings of the following article attempt to analyze the emerging patterns in the Bitcoin Cash short-term market and its impact on the price.
The value of Bitcoin Cash has been slipping lower and even as the largest crypto asset, Bitcoin consolidates, it has not helped the BCH price.
At press time, BCH was noting a selling pressure and was being traded at $257.64.
Bitcoin Cash 1-hour chart
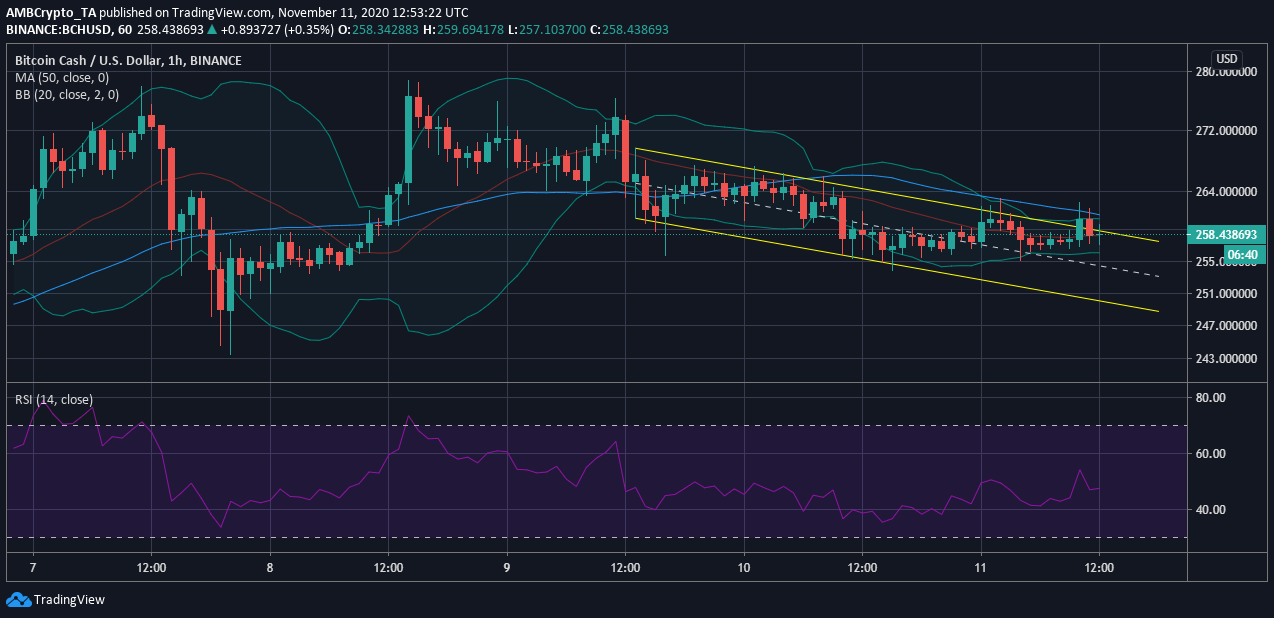
Source: BCH/USD on TradingView
Even though the above hourly chart of Bitcoin Cash the value of the digital asset was being restricted within a descending channel. The descent of the coin has resulted in the market trend side by the bears.
Reasoning
The support marked at $256.21 has been tested repeatedly over the past couple of days. BCH has briefly breached this support but has managed to bounce back.
Meanwhile, the 50 moving average moved above the candlesticks recently, indicating the price moving lower. Along with the Bollinger Bands, that noted the volatility in the market has also reduced. Although bearish, the momentum in the market has been moving towards a consolidation phase and BCH may have to move within the $255 and $261 range in the short-term, before witnessing a price swing.
The Relative Strength Index affirmed this sideways movement of the market as the buying and the selling pressures were evened out. Even though the value noted at press time was 45.76, which was leaning towards the oversold zone, there wasn’t much momentum for BCH to witness a sudden reversal.
Conclusion
As the price of BCH continues to move within the restrictive range, the low volatility has contributed to the sustenance of this trend in the short term. There could be a price swing witnessed in the longer term, but the bears might get to it first.


