Analysis
Bitcoin Cash, IOTA, Enjin Price Analysis: 06 December

Bitcoin Cash exhibited some volatility over the past two weeks, with the market appearing to be indecisive at press time, although a downside seemed like a safer bet. Bitcoin will have a huge influence on BCH going forward while IOTA was trading within a rectangle and awaited a breakout backed by strong volume. Enjin formed an ascending channel and the market’s bulls were attempting to flip the $0.154-level of resistance to support.
Bitcoin Cash [BCH]

Source: BCH/USDT on TradingView
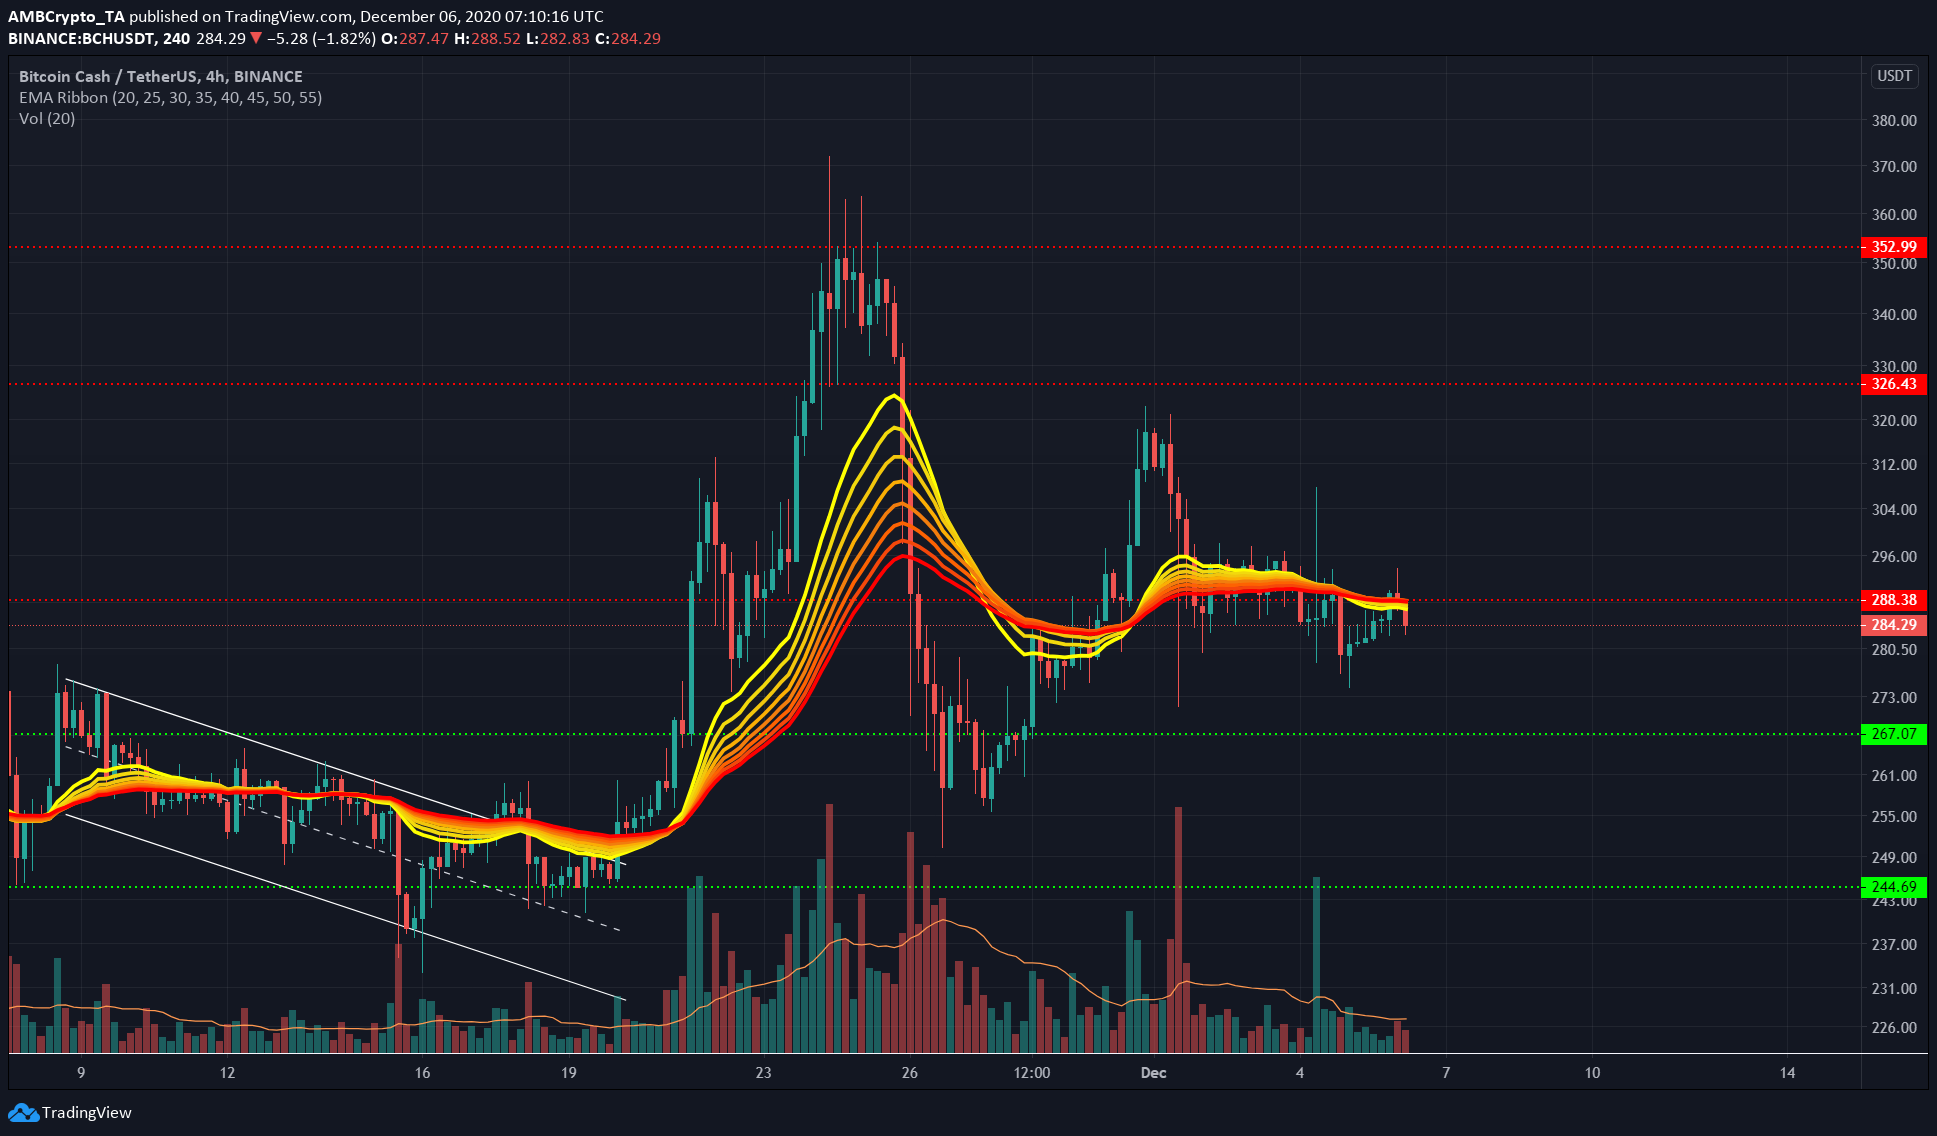
The EMA Ribbons spun a tale of indecisive sentiments behind BCH over the past couple of weeks. The ribbons swayed from bullish to bearish and then back to bullish as December began and at the time of writing, appeared to flip once more.
This lagging indicator tried to keep up with BCH as it swayed from a local high of $352 to drop under the $267-support level just a few days later.
At the time of writing, Bitcoin Cash was valued at $284.5, trading right under the support level at $288. It was likely that Bitcoin Cash would head lower on the charts. However, a spike in trading volume combined with a green or red session would reveal more about the market’s next direction.
IOTA
Source: IOTA/USD on TradingView
IOTA formed a rectangle top pattern, a pattern that can see the price break out in either direction. A close outside either boundary would need to be closely monitored before a position can be entered, as the price can also experience a throwback and reverse to effect a breakout in the opposite direction.
The OBV and trading volume showed minimal activity from market participants over the past few days. The boundaries at $0.36 and $0.322 have acted as able resistance and support levels.
Due to the oscillatory price action, IOTA did not see momentum in either direction. Hence, traders are waiting for a breakout before taking a position, something that explains the recent lows in trading volume.
Enjin [ENJ]
Source: ENJ/USDT on TradingView
ENJ formed an ascending channel, with a couple of breakouts that were quickly reversed. The RSI showed that at the time of writing, the momentum was largely neutral.
On the price charts, ENJ approached the level of resistance at $0.154 once more after it breached the level earlier this week, but failed to hold on in the face of selling pressure.
A close under the channel would see $0.143 act as support, and a drop under this level could take ENJ to the $0.132-support level. $0.162, the highs from earlier this week, would be the initial target for the market’s bulls if $0.154 is successfully scaled.

