Analysis
Bitcoin Cash, Cosmos, DigiByte Price Analysis: 03 October

The first of September saw a market-wide sell-off and the first of October saw some selling pressure throughout the market as well. At the time of writing, Bitcoin Cash was trading between two important levels and appeared bearish in the near-term. Further, Cosmos could test a level of support over the next few trading sessions, but whether it bounces or drops under the same was yet to be made clear. Finally, DigiByte could see further losses in the near-term.
Bitcoin Cash [BCH]

Source: BCH/USDT on TradingView
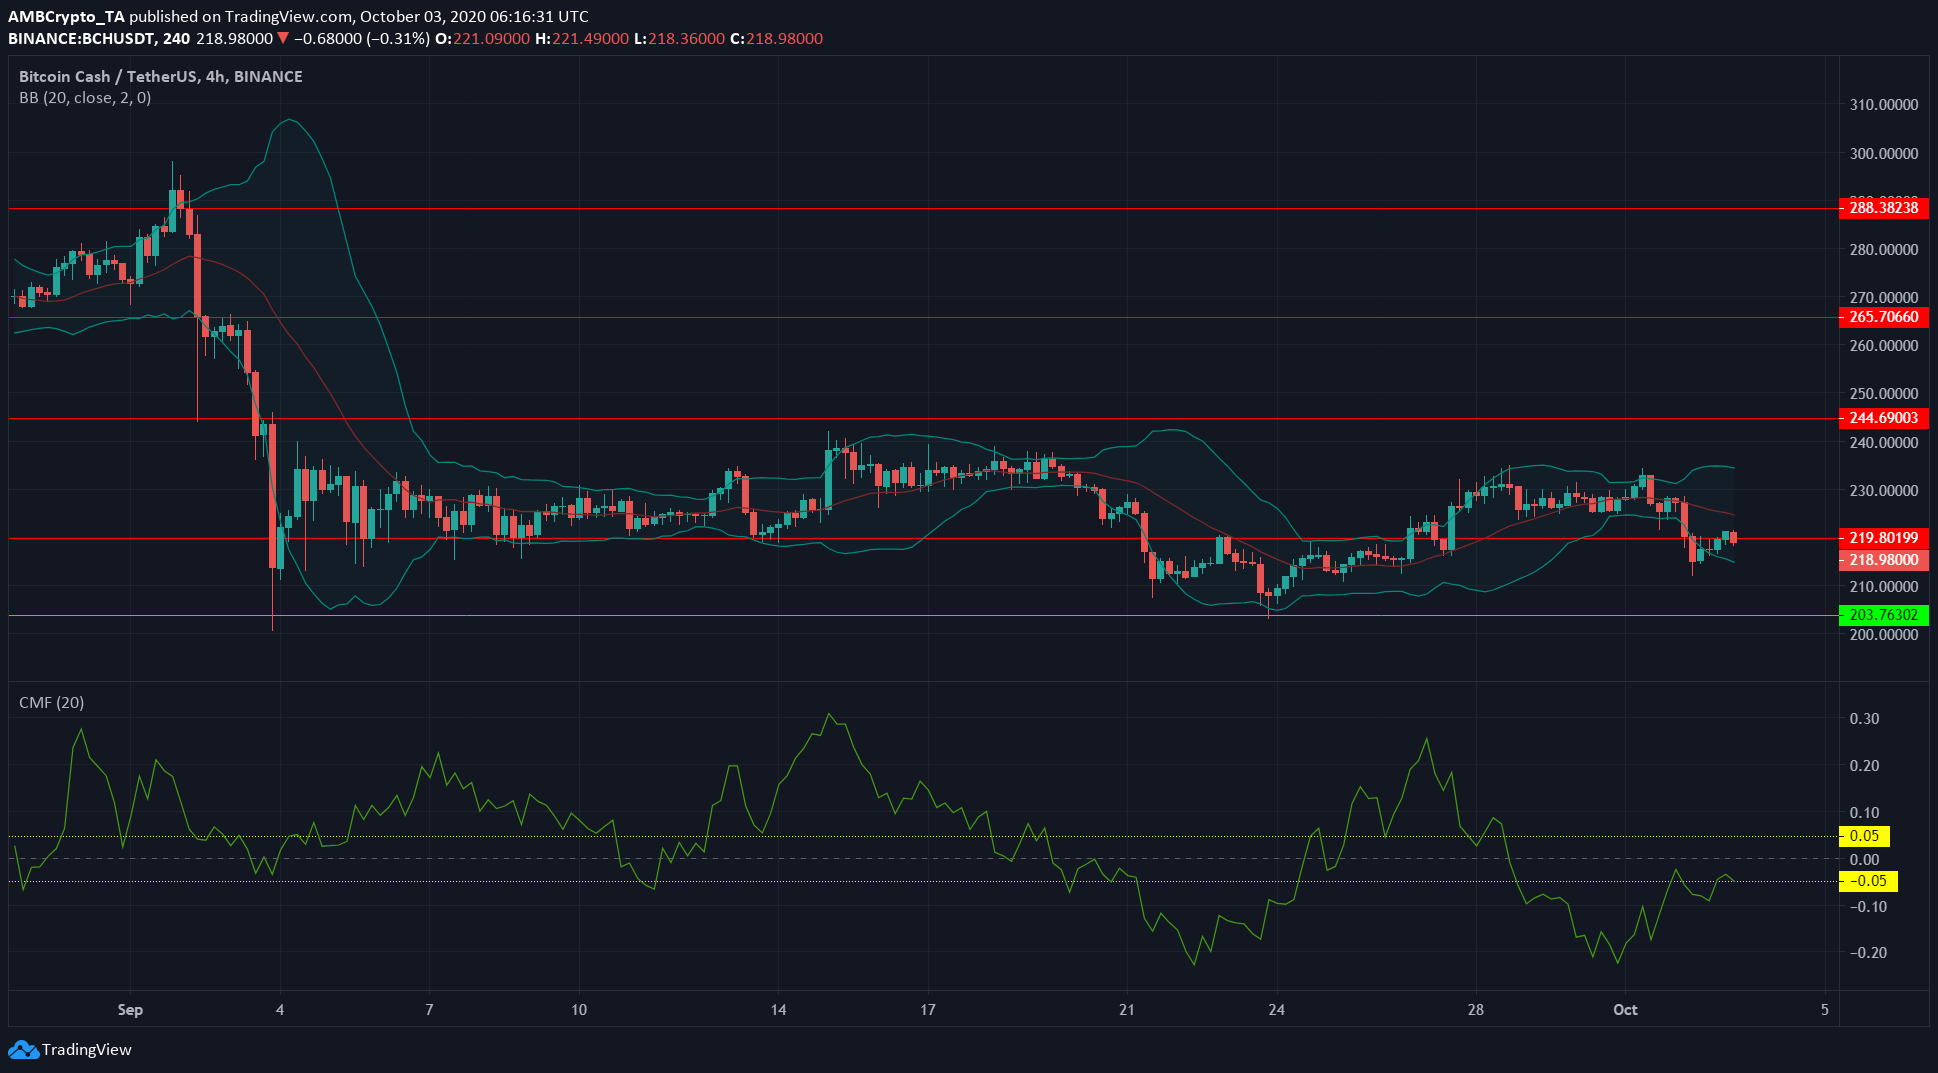
The levels of $226 and $235 have been important for BCH over the past month. In a bearish turn, BCH was trading beneath both these levels at $218.7, around the support at $219.
The Chaikin Money Flow showed how buyers and sellers were tussling for control of the market. Even when the capital was flowing out of the market (that is, when CMF noted negative values), the sellers were unable to drive the price beneath the $200-level.
Yet, even when the CMF was positive, buyers were unable to drive the price beyond $235.
The Bollinger bands recently contracted, before expanding as the price broke beneath the $219-level. This indicated that the price was likely to dip further, but $200 can be expected to be a strong level of support.
Cosmos [ATOM]
Source: ATOM/USD on TradingView
ATOM broke out of a descending broadening wedge (shown in white) and flipped the level of resistance at $4.81 to support. It had a projected target of $5.85 after a breakout from the pattern, but the resistance at $5.45 was stiff.
The above-average trading volume on the defense of the support showed that $4.8 could hold for another retest. Beyond that, weaker bounces by the price off the said support would be bearish for the crypto-asset in the short-term.
DigiByte [DGB]
Source: DGB/USD on TradingView
DGB surged from $0.2 to $0.32 and slumped back to $0.22, before a spike to $0.28, all within the past three weeks. At press time, DGB had lost support at $0.256 and looked to be headed lower on the charts.
In the near-term, the next level of support for DGB was once again the $0.22-level.
The RSI showed a value of 46, and the inability of the price to hold the $0.256 support also supported the idea of near-term bearishness as the price dipped beneath the support-turned-resistance, then re-tested the same level.

