Analysis
Binance Coin’s falling wedge pattern may push price upward

Changpeng Zhao-led cryptocurrency exchange, Binance seems to be taking over the crypto industry by initiating several developments in the ecosystem. The exchange might be looking into global expansion following the launch of Binance.US and P2P trading functionality that enabled users to trade selected cryptocurrencies against the Chinese Yuan. These developments seem to be impacting the price of the exchange’s native cryptocurrency, BNB as it was rising by 5.22% in the last 24-hours, while all the other currencies witnessed very little price change, at the time of writing.
BNB is the eighth largest cryptocurrency with a market cap of $2.78 billion while the price of the coin stood at $17.89, at press time. The coin recorded a volume of $261.10 million over the last 24 hours where most of it came from the P2PB2B exchange via BNB/USD.
1-Day Price Chart

Source – BNB/USD on Trading View
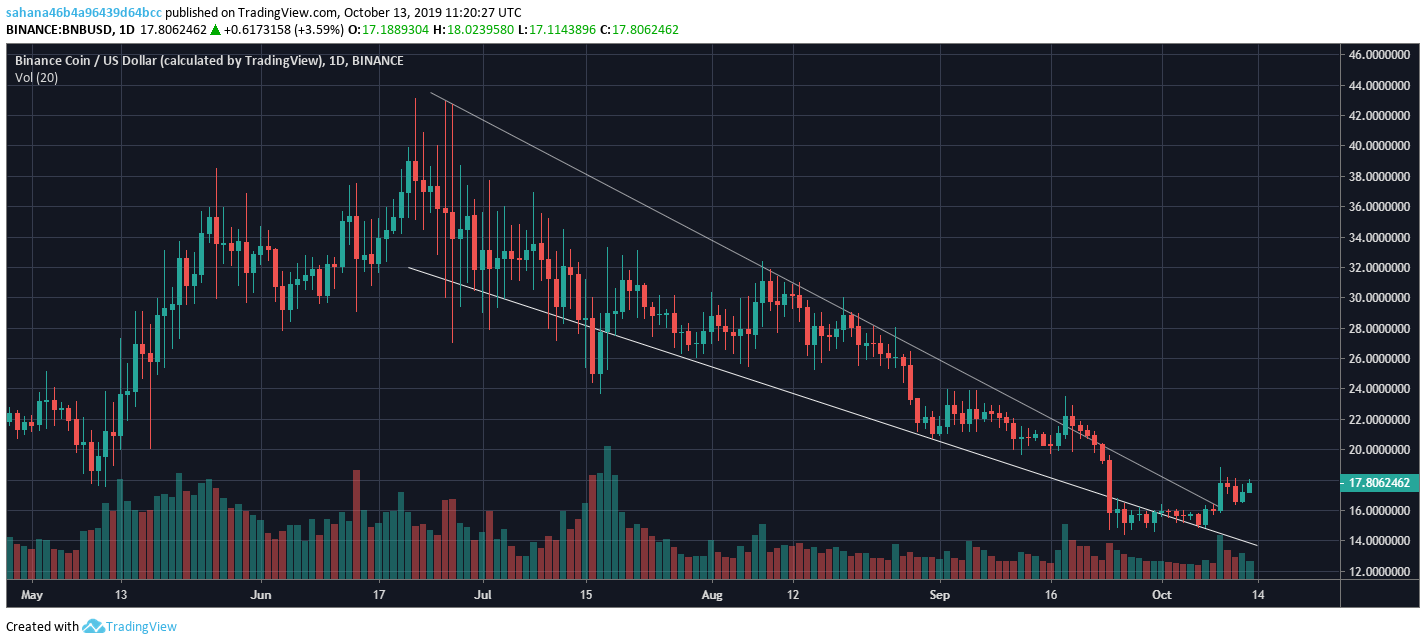
The one-day chart for BNB developed two downward-sloping trend lines further forming a falling wedge pattern. The upper resistance line exhibited lower highs at $42.94, $31.66 and $16.49. The lower support line formed lower lows at $30.71, $20.67 and $14.81. Additionally, the pattern started forming during the last week of June and extended to the second week of October. The falling wedge pattern formed in the chart indicated a breakout in the upward direction.
Source – BNB/USD on Trading View
Key indicators like MACD and RSI also affirmed the potential upward breakout as MACD line was seen way above the signal line indicating a bullish crossover. RSI indicator was seen recovering from the oversold zone and was heading toward the overbought zone.
Conclusion
The one-day price chart for Binance’s BNB revealed formation of a falling wedge pattern, further indicating a breakout in the upward direction. The aforementioned key indicators, MACD and RSI, also affirmed the presence of bulls in the BNB market.

