Binance Coin long-term Price Analysis: 24 July

Disclaimer: The following article attempts to analyze the evolving trend in the long-term Binance Coin market and its impact on BNB’s price
With Bitcoin going over $9,500 earlier this week, the rest of the coin market saw a substantial boost. Binance Coin, was one of the major beneficiaries of this hike, and at press time, it was the second-highest gainer in the top-10. However, the exchange token is just about capping off the top-10 with a market capitalization of $2.68 billion, only $4 million ahead of Crypto.com, in 11th place, and is closing in.
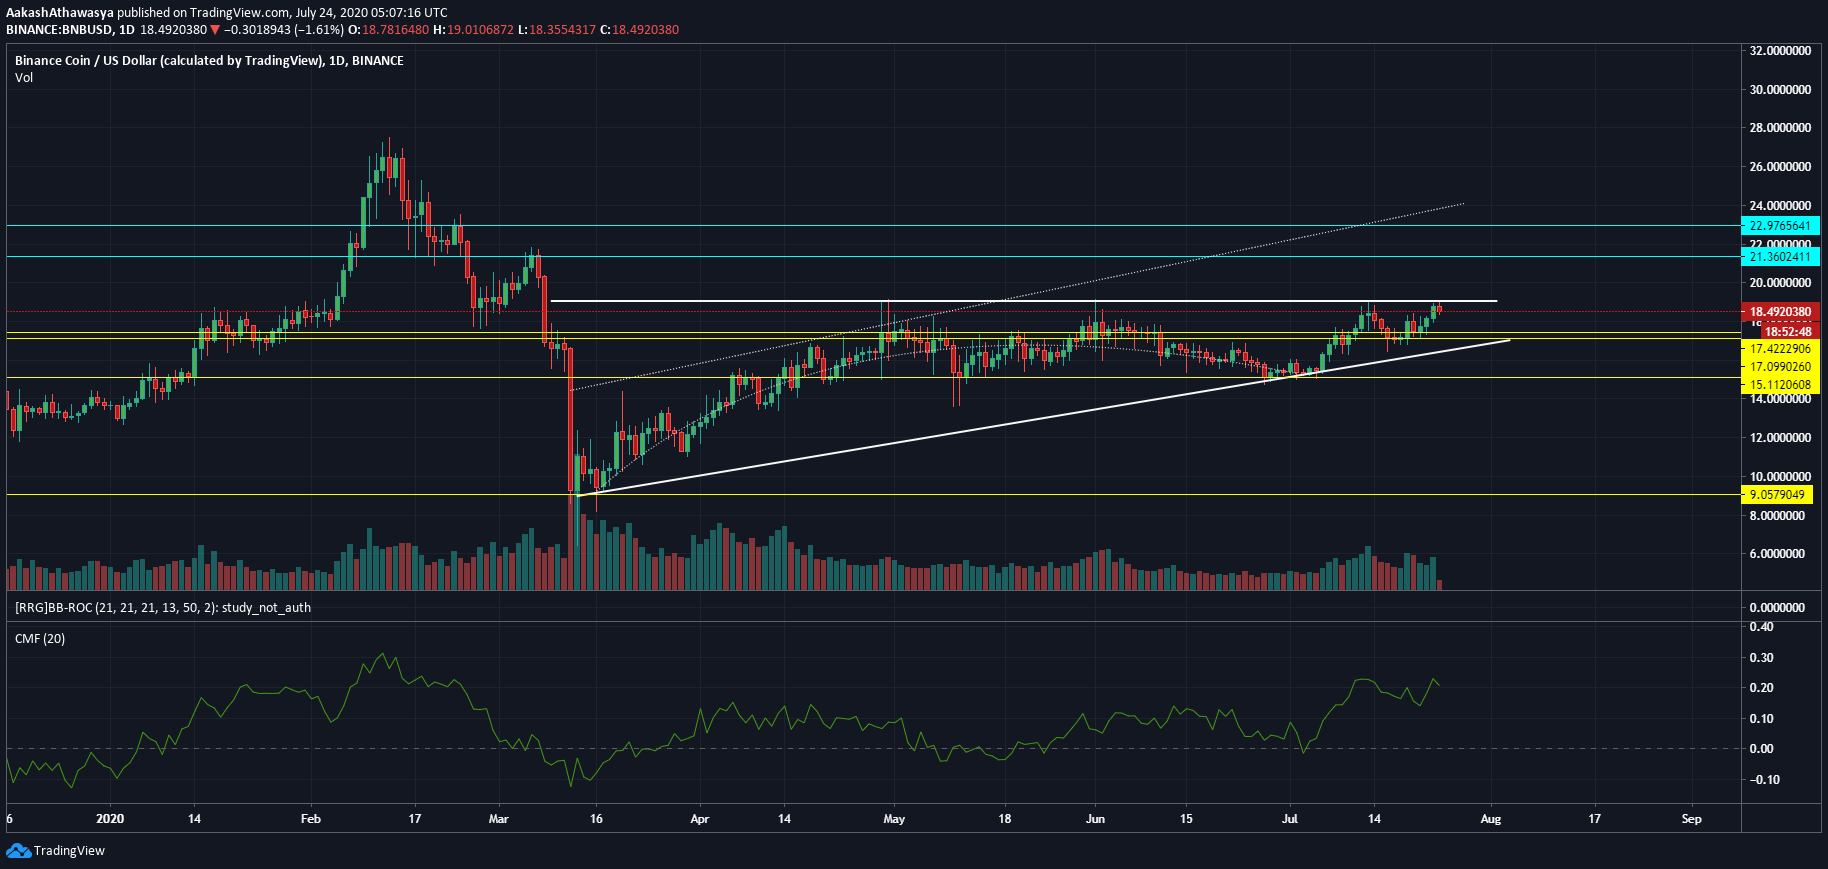
Given the volatility of the cryptocurrency markets, long-term movement can be seen better in its daily than its weekly premise. BNB’s long-term chart, despite seeing a mid-week rise, thanks in large part to Bitcoin, is unlikely to continue its rally. Since 18 July, BNB’s price has jumped from $16.72 to its current price of $18.15 but is not looking to hold given Bitcoin’s receding push, and the presence of several resistance levels in the exchange token’s near future.
Speaking of resistance, the first very clear resistance was found at $19.12, the top of the ascending triangle, which BNB has been trading in since March. It should be noted, in the most optimistic sense, however, that this is the first time the body, and not the wick of the candlestick has come close to the resistance of the triangle, previously trying for a breakout on 3 occasions: 27 April, 31 May and 14 July respectively. Each of the aforementioned efforts failed but managed to post higher highs on the daily charts. BNB, before rebounding off the level traded at $18.82, its highest price since the March drop.

Source: BNBUSD via Trading View
The period from April to June for the exchange token could be divided into two halves – an immediate rally, followed by a period of stagnation. This quick rise to $17.42 prior to a drop to $15.11 saw BNB trade in an eclipse formation but maintained above the two support levels. As its price looks to hit and fall below the ascending triangle’s top, the following levels should show support, $17.42, $17.09, and if a major drop occurs it may push the price to $15.11.
With the triangle looking to squeeze the price out, an upward breakout is the norm, however, such a move is likely to manifest only by the end of next month, if the market stays stable. In terms of volume BNB has regained its footing, posting a 24-hour volume of $208 million, whereas, at the beginning of the month, daily-volume stood at around $135 million. Since the start of the month, BNB’s Chaikin Money Flow indicator has also been moving up from below 0 to as high as 0.21, which explains why the exchange token got a bigger boost than its altcoin peers when Bitcoin jumped over $9,500.
As far as chart patterns go BNB is looking good for an upward breakout, its consistent volume and money inflow are proving as much. Resistance on the upside lies at $22.97 and $21.36, and one can expect the latter resistance to hold strong if a move towards it does occur. However, given its leverage with the king coin, a Bitcoin breakdown could have a detrimental effect on Binance Coin compared to other altcoins and if so, support lies at $17.44 and $17.09.


