Crypto News
Binance Coin, Ethereum Classic, VeChain Price Analysis: 2 September

Binance Coin rose above the resistance level and looked likely to retest the same level to confirm a resistance-flipped-to-support zone. Ethereum Classic lost a support level and looked likely to be headed further downward. VeChain had recently shown signs of bullishness, and a reversal of its downtrend since reaching $0.022 highs. But it was rejected at resistance and might continue its previous depreciation.
Binance Coin [BNB]

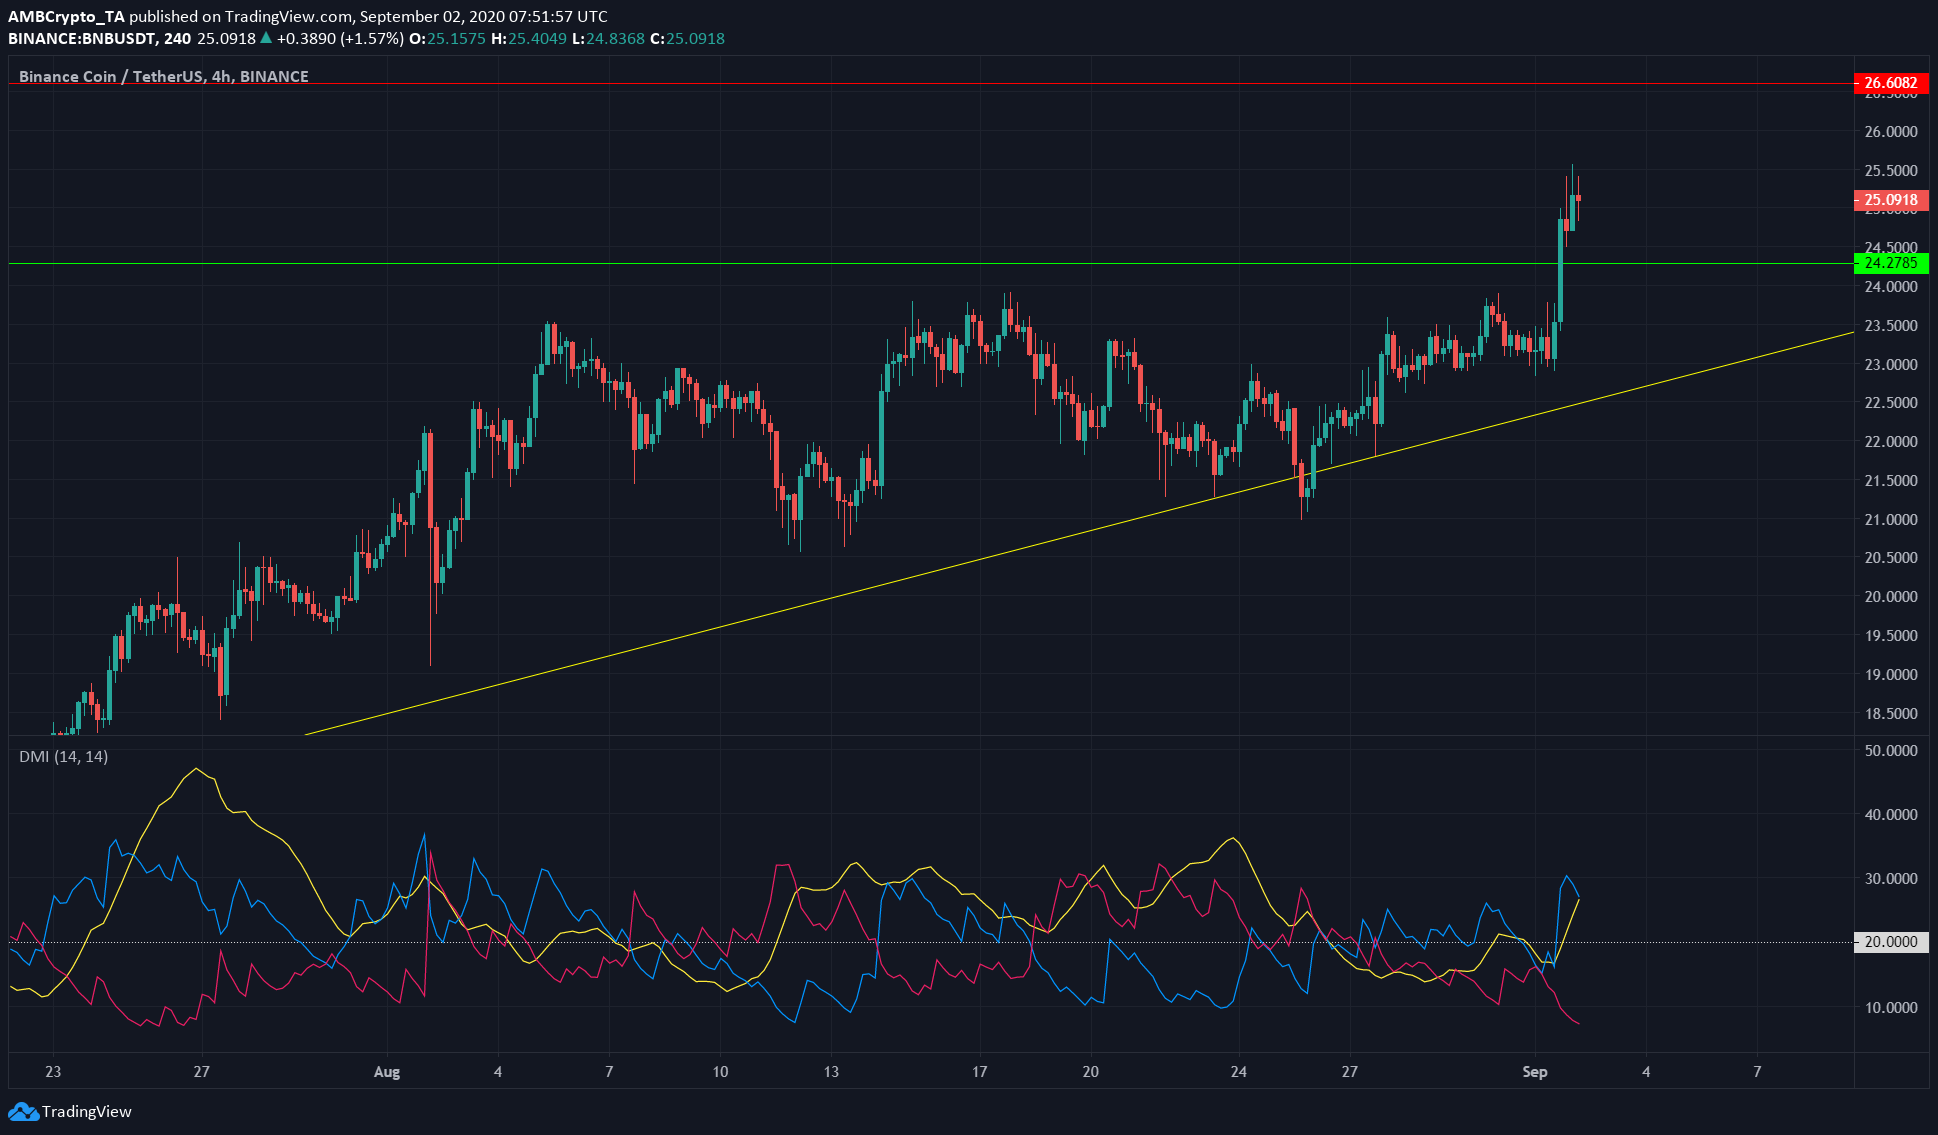
Source: BNB/USDT on TradingView
Binance Coin had a 24h trading volume of $562 million, which was nearly twice the daily average of the month of August. It was ranked 9, with a market cap of $3.62 billion.
BNB surged above resistance at $24.7 zone to flip it to support. It was trading at $25.09 at the time of writing. BNB might retest support at $24.7 before another move upward.
The uptrend formed from June’s beginning (yellow) could also be expected to act as support.
Directional Movement Index showed a strong uptrend, with +DMI (blue) above -DMI (pink) to show bullish trend, while ADX (yellow) line above 20 showed it was a strong trend.
Ethereum Classic [ETC]
Source: ETC/USD on TradingView
Ethereum Classic did not look to have recovered in the markets after it suffered its third 51% attack in the month of August alone. Bollinger bands appeared to be broadening, and the price was moving toward the lower band at press time. This can indicate that ETC will dip further.
Parabolic SAR also gave the sell signal, and has been the case for the past few days.
It has support in the $6 zone.
VeChain [VET]
Source: VET/USDT on TradingView
VeChain holds rank 25 on CoinMarketCap, with a market capitalization of $922 million.
VET formed a falling wedge, which is recognized as a bullish reversal pattern. It saw its price surge above resistance at $0.0178 with a high trading volume. Yet, shortly afterward, VET got rejected and was headed toward $0.0159 support.
In the coming days, the reaction of the price at support and resistance along with the zone in which RSI remained, will give an idea of whether VeChain will continue to buckle under selling pressure.

