Analysis
Binance Coin, EOS, VeChain Price Analysis: 29 August

Binance Coin regained most of the losses following its most recent pullback, with BNB prepping for another upward move on the charts. At the time of writing, VeChain was showing strong bearish signals, while also exhibiting signs of a potential reversal that could play out in the coming days. EOS was another cryptocurrency that was caught in a strong downtrend. However, it could change direction after reclaiming support and invalidating the short-term downtrend.
Binance Coin [BNB]

Source: BNB/USDT on TradingView
Binance Coin was ranked 10th on CoinMarketCap’s charts with a market capitalization of $3.35 billion, at the time of writing.
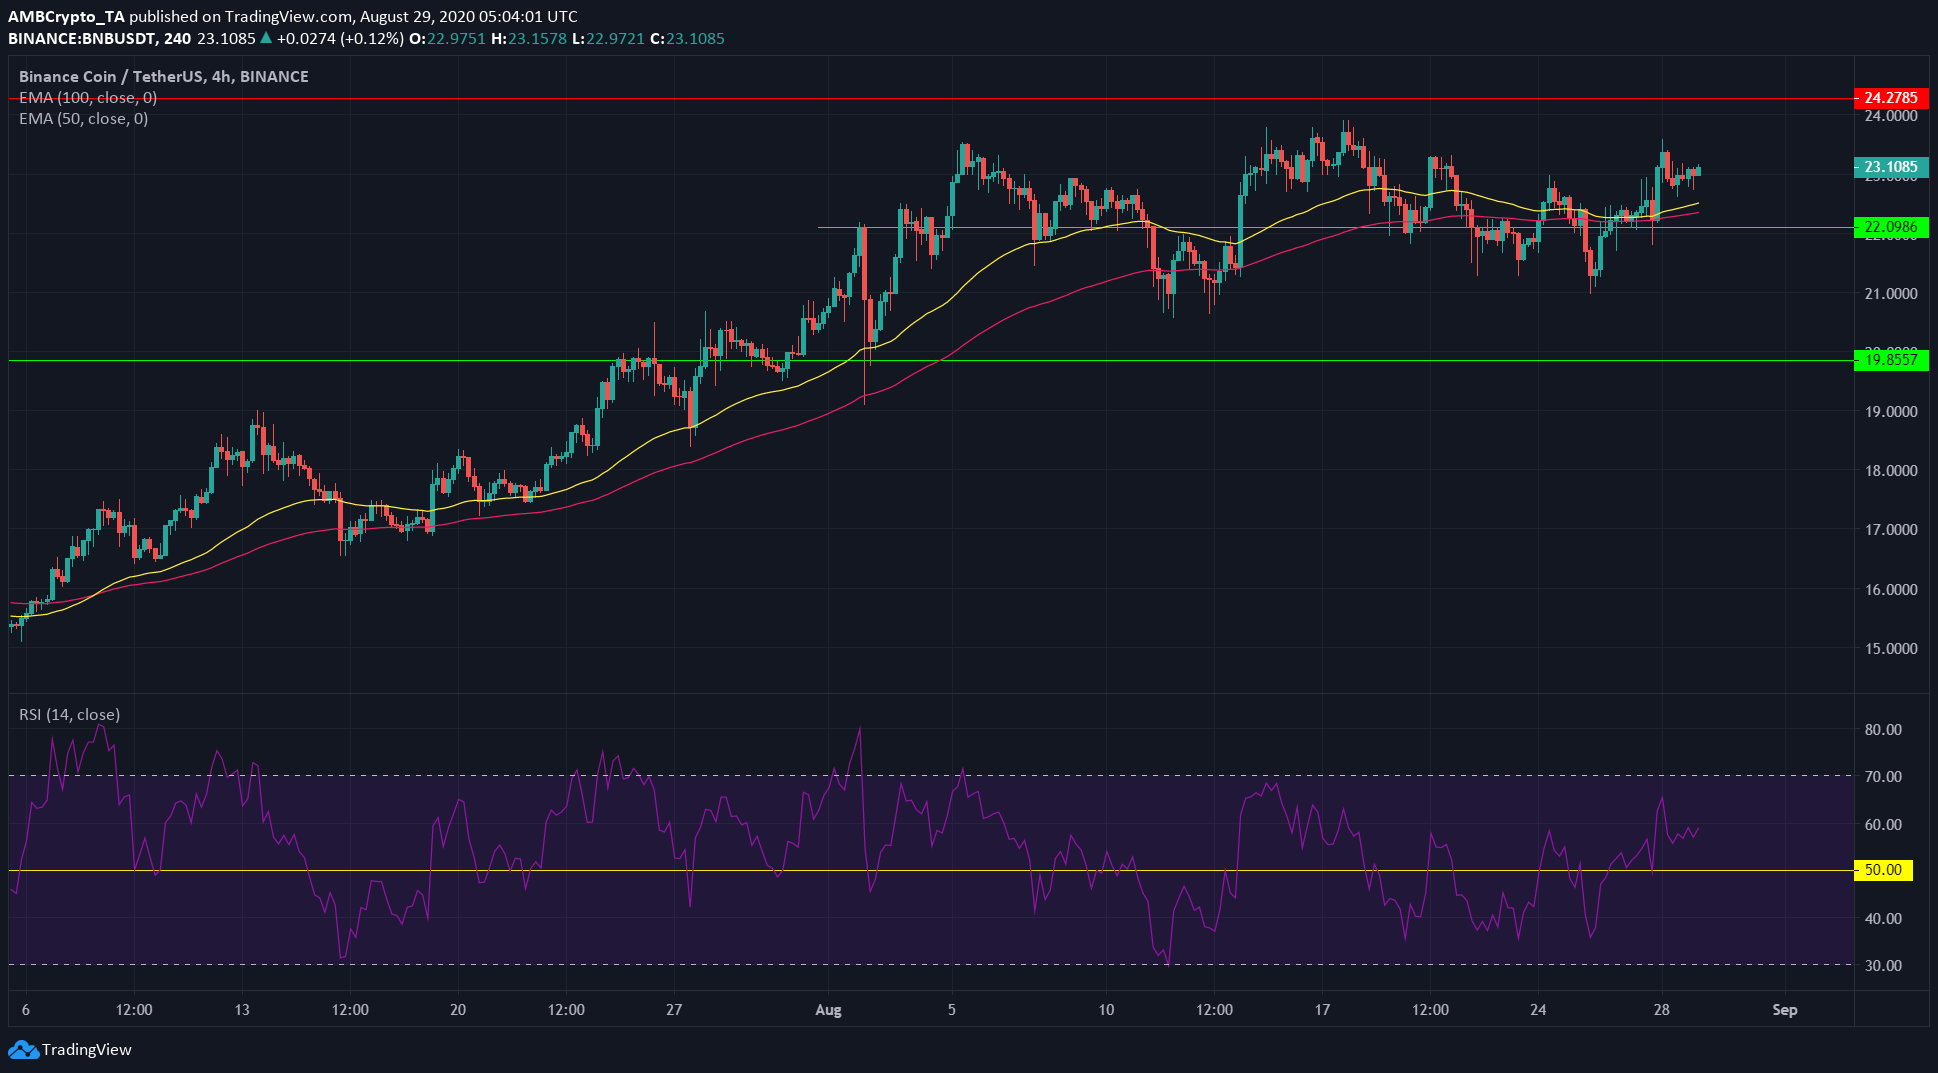
The 50 EMA (yellow) continued to stay above the 100 EMA (pink), highlighting that the previous month’s uptrend had not yet been broken. Further, Binance Coin noted a pullback and some short-term bearishness in mid-August, movement that accompanied Bitcoin’s drop from $12,500.
At the time of writing, the RSI showed a value of 58, having not broken below the neutral zone around 50 in the past few days. Taken together with the exponential moving averages, this showed that BNB could test its resistance at $24.
EOS
Source: EOS/USDT on TradingView
EOS faced major sell-offs after scaling a peak at $3.9. At the time of writing, it was trading at $3.12, a 30% drop in just a few weeks. EOS was struggling to break past the trendline (yellow) but recently moved above it, with a candlewick down to re-test trendline as well.
The move above the trendline was accompanied by above-average volume, signifying decent strength behind the move and making the surge less likely to be an anomaly.
With the next support in the $3.05 zone, EOS can be expected to briefly move down to test the support, before deciding on its next move. Finally, the Bollinger bands leveled out around the price at press time, indicating that the consolidation of the asset’s price above the support level was likely.
VeChain [VET]
Source: VET/USDT on TradingView
VeChain did not show strong momentum as it moved downwards. Nevertheless, it has steadily been slipping in price throughout August. The Directional Movement Index (DMI) showed that the bearish trend had strengthened over the past week, with ADX (yellow) above 20 and -DMI (pink) above +DMI (blue) to signify the direction of the trend.
On the other hand, VET seemed to form a falling wedge. It is a bullish reversal pattern. If price breaks out to the upside, above the upper trendline (yellow) and is confirmed by the above-average trading volume, the falling wedge would be validated.
The upside target would be $0.022, and if reached, the uptrend can be expected to continue at that price as well.
If the support at $0.0159 fails, the pattern could be invalidated and VET will continue to drop toward the support at $0.0139.

