
Bearish momentum in the market was clearly visible on the trading charts of Binance Coin, Cosmos and Basic Attention Token.
Binance Coin and Cosmos, ahead of a major downward move, were attempting to retrace some gains at press time, however an overall bearish scenario was maintained for both the alts.
In the case of Basic Attention Token strong selling pressure kept the digital asset’s prices just above a key support level.
Binance Coin [BNB]
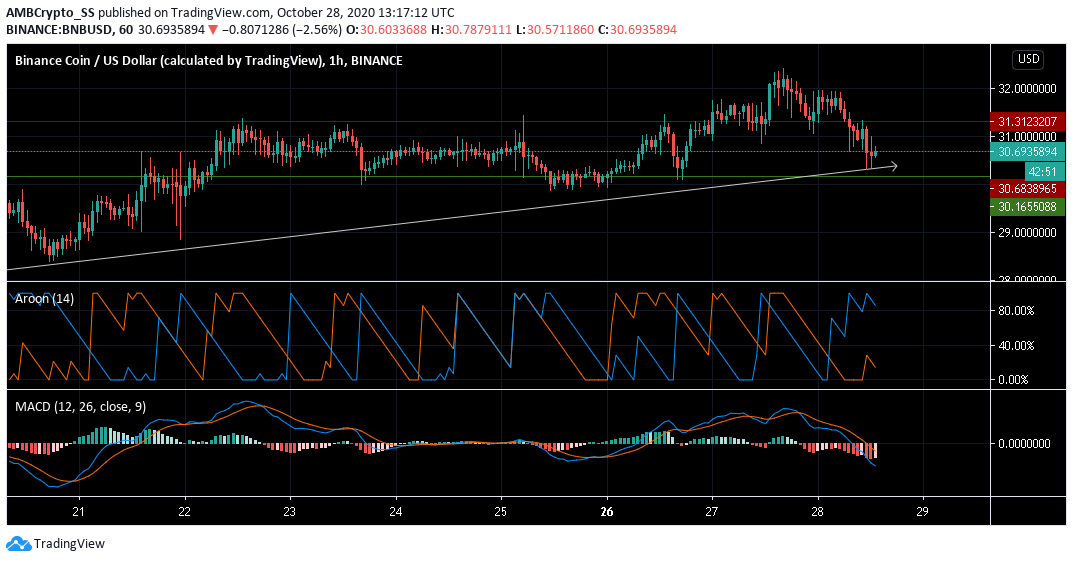
Source: BNB/USD on TradingView
Binance coin succumbed to a market-wide sell-off with a 5% move to the downside over the last 24 hours. At press time, it was trading at $30.69
Aroon Indicator with Aroon Up (orange) below the Aroon Down (blue) continued to be highly bearish
MACD also seen making a bearish crossover, with both the MACD and signal lines below the zero level gave strong sell signals for the short term.
A bounce may be expected near its support at $30.165, however the immediate trading sessions are likely to be bearish.
Cosmos [ATOM]
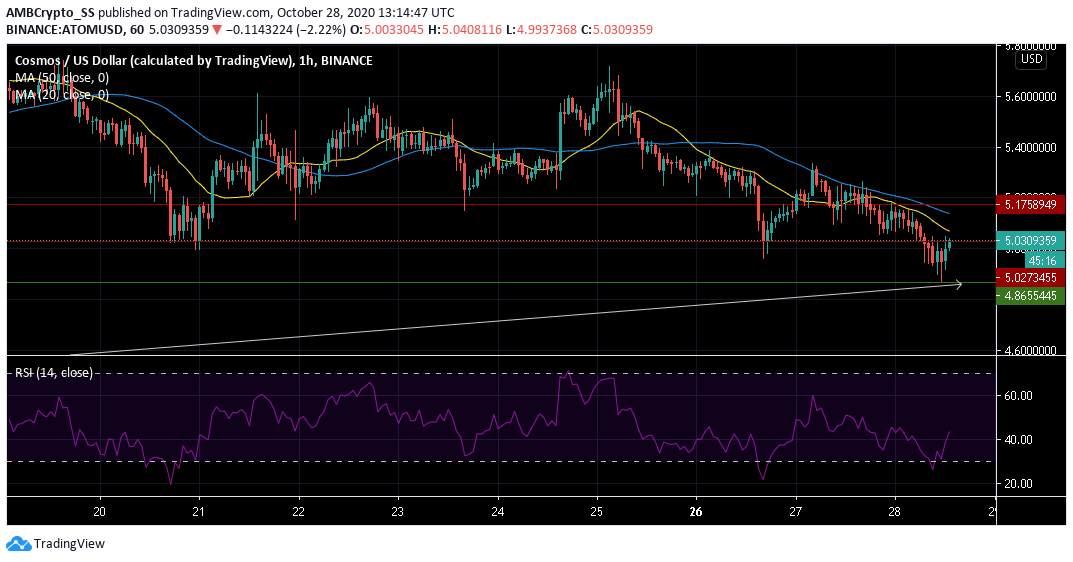
Source: ATOM/USD on TradingView
The $4.865 level remains a key area of support for Cosmos. The price movement follows a rejection at the $5.17 and thereafter $5.02 resistance levels over the last 48 hours.
Diving all the way down to $4.86 also pushed the ATOM market below both of its 20 and 50 period moving averages, depicting strong selling sentiment.
In a bearish scenario the 20 SMA (yellow) lay beneath the 50 SMA (blue). This further depicted weakness in the attempt of the bulls to regain control at the $5.02 resistance level, at press time.
The Relative Strength Index, however highlighted the possibility of a reversal. The RSI was seen rising, indicating presence of positive buying pressure.
Basic Attention Token [BAT]
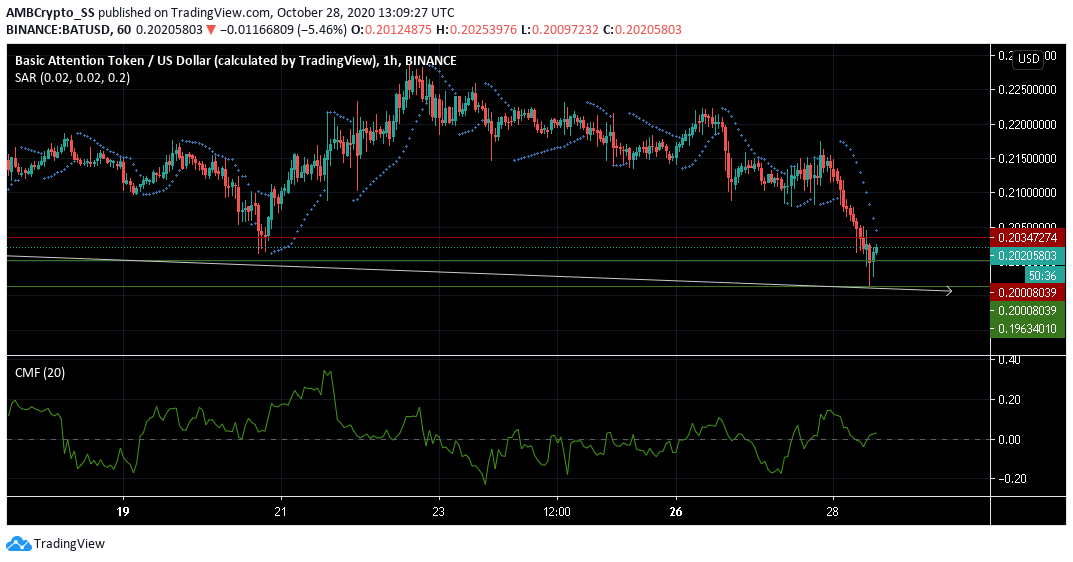
Source: BAT/USD on TradingView
Basic Attention Token was persistently displaying a downtrend since the past one week on its trading charts. In fact, the digital asset recorded almost 5.6% in losses since yesterday and was trading at $0.202.
The dotted lines of the Parabolic SAR above the candles still supported a downtrend. Chaikin Money Flow Indicator remained neutral. However, hinting capital inflows still remained higher than capital outflows.