Analysis
Binance Coin, Aave, Crypto.com Coin Price Analysis: 08 November

Binance Coin has been one of the few exchange tokens to have performed well over the past few weeks. While it did note a pullback on the charts, it was otherwise likely to continue the short-term uptrend it was on. Aave could drop a few percentage points more in value before another attempt at climbing past a stubborn level of resistance. Crypto.com Coin faced steady selling pressure and registered a stream of small losses almost daily.
Binance Coin [BNB]

Source: BNB/USDT on TradingView
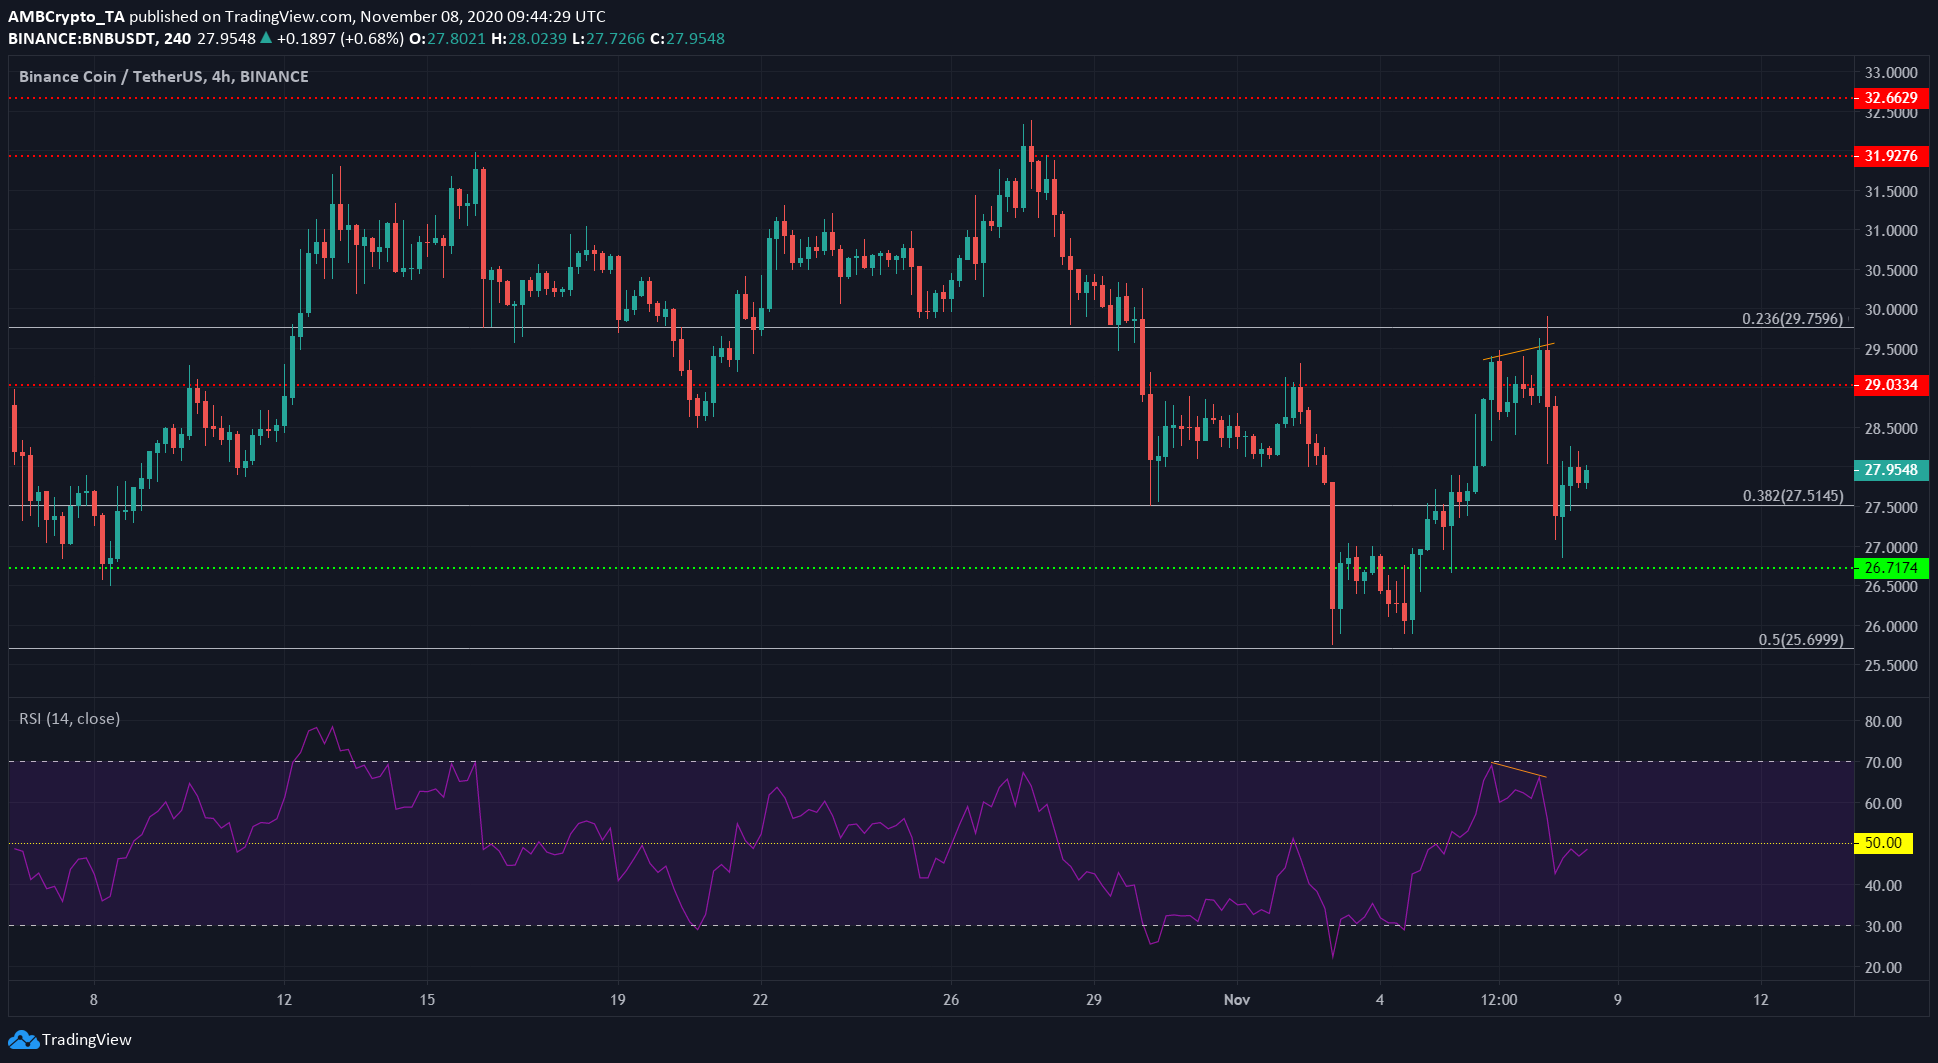
Binance Coin noted a bearish divergence (orange) between the price and the momentum and dropped from $29.5 to wick down as low as $26.85. BNB’s correction also coincided with Ethereum’s drop from $462 to $430.
The Fibonacci Retracement tool was used for BNB’s move from $18 to $33.4 in early September to highlight some levels of importance for BNB in the coming days.
However, the RSI showed that BNB still maintained its uptrend as it did not dip significantly under the neutral 50-level. The price also registered a higher low and found some support in the region of its 38.2% retracement level at $27.5.
$29 can be expected to heap selling pressure on BNB, but the positive sentiment in the crypto-space and around BNB was likely to help the bulls flip the level from resistance to support.
Aave [AAVE]
Source: AAVE/USDT on TradingView
On the hourly charts, the MACD showed waning bullish momentum for AAVE as it formed a bearish crossover above zero. The price was also forced beneath the resistance at $46 once again, after the previous ascent past the level saw a drop from $49.5 to $42.
Another re-test of the $42 support could be on the cards, but thereafter, AAVE would need to bounce higher than $45 to maintain a strong bullish trend. A weaker bounce would signal an incoming drop to $35 for AAVE.
The Stochastic RSI was moving south towards the oversold region, alongside the price’s leg down on the hourly, further reinforcing the $42 region of support as a likely region for AAVE to bounce off of.
Crypto.com Coin [CRO]
Source: CRO/USDT on TradingView
CRO was valued at $0.073, at press time, a value it previously held in the last week of May earlier this year.
The Directional Movement showed a strong trend as the ADX (yellow) was above 20, with the -DI (pink) highlighting the bearish nature of the trend.
The OBV has also trended southbound over the past month, with steady lower highs posted on the indicator.

