
- A bearish divergence was noted on a key BTC metric’s chart.
- BTC was down by 2%, and a few metrics were bearish.
Bitcoin’s [BTC] price somewhat took a sideways path over the last seven days as it only moved marginally. The bad news was that a bearish divergence was noted on BTC’s graph, which suggested a drop in the king of cryptos’ price over the coming days.
Bitcoin bears are taking over
Over the last month, BTC registered a promising rally, allowing investors to earn profits. As reported earlier by AMBCrypto, 80% of Bitcoin addresses were in profit.
This increase in profitable Bitcoin addresses may encourage holders to think about selling their holdings. An analysis of CryptoQuant’s data found that the possibility of investors selling BTC was becoming a reality.
BTC’s exchange reserve was also increasing. Additionally, its net deposit on exchanges was high compared to the last seven-day average, meaning the selling pressure on the coin was high.
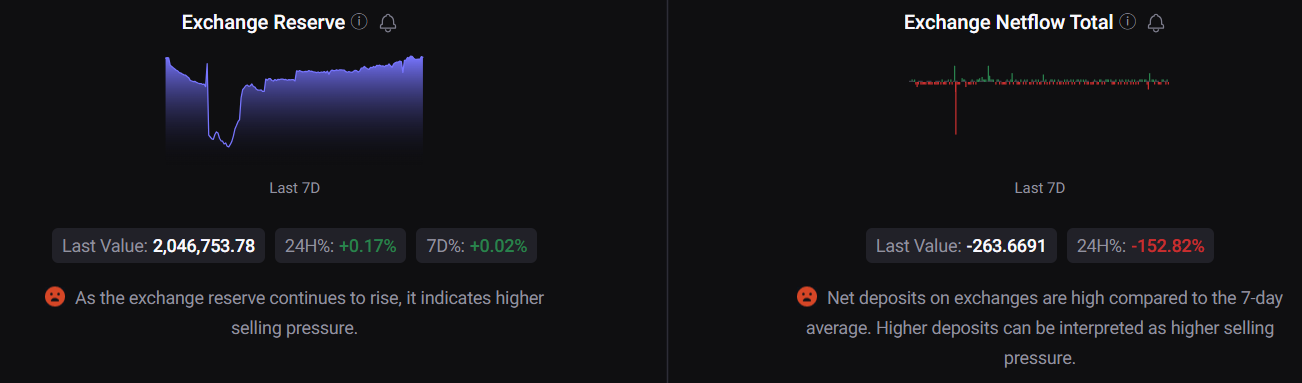
Source: CryptoQuant
The increase in selling pressure had a negative impact on the coin’s price. CoinMarketCap’s data pointed out that BTC’s price dropped by more than 2% in the last 24 hours.
A bearish signal was BTC’s trading volume, which surged while its price dropped. At the time of writing, BTC was trading at $35,620.69 with a market capitalization of over $696 billion.
Things could get even worse, as the latest data looked pretty bearish.
Ali, a popular crypto analyst, recently posted a tweet highlighting the fact that a bearish divergence formed on BTC and its network growth’s chart. For starters, when Bitcoin’s price moves up but network growth slows down, it typically suggests a trend reversal.
#Bitcoin | When $BTC price climbs, but network growth slows down, it's a red flag. It suggests the uptrend might not have enough momentum to sustain.
This bearish divergence between #BTC price and network growth is an on-chain sell signal traders should be aware of. pic.twitter.com/QvJ2HwelBh
— Ali (@ali_charts) November 14, 2023
Is a further price drop inevitable?
A closer look at BTC’s metrics provided a better understanding of the possibility of a further downtrend. Bitcoin’s aSORP was red, meaning that more investors are selling at a profit.
In the middle of a bull market, it can indicate a market top. However, when AMBCrypto examined BTC’s supply, a different picture was revealed.
BTC’s supply outside of exchanges continued to remain higher than its supply on exchanges. Whale activity around BTC also remained high.
Additionally, market sentiment around BTC was positive, as evident from the recent rise in its weighted sentiment.
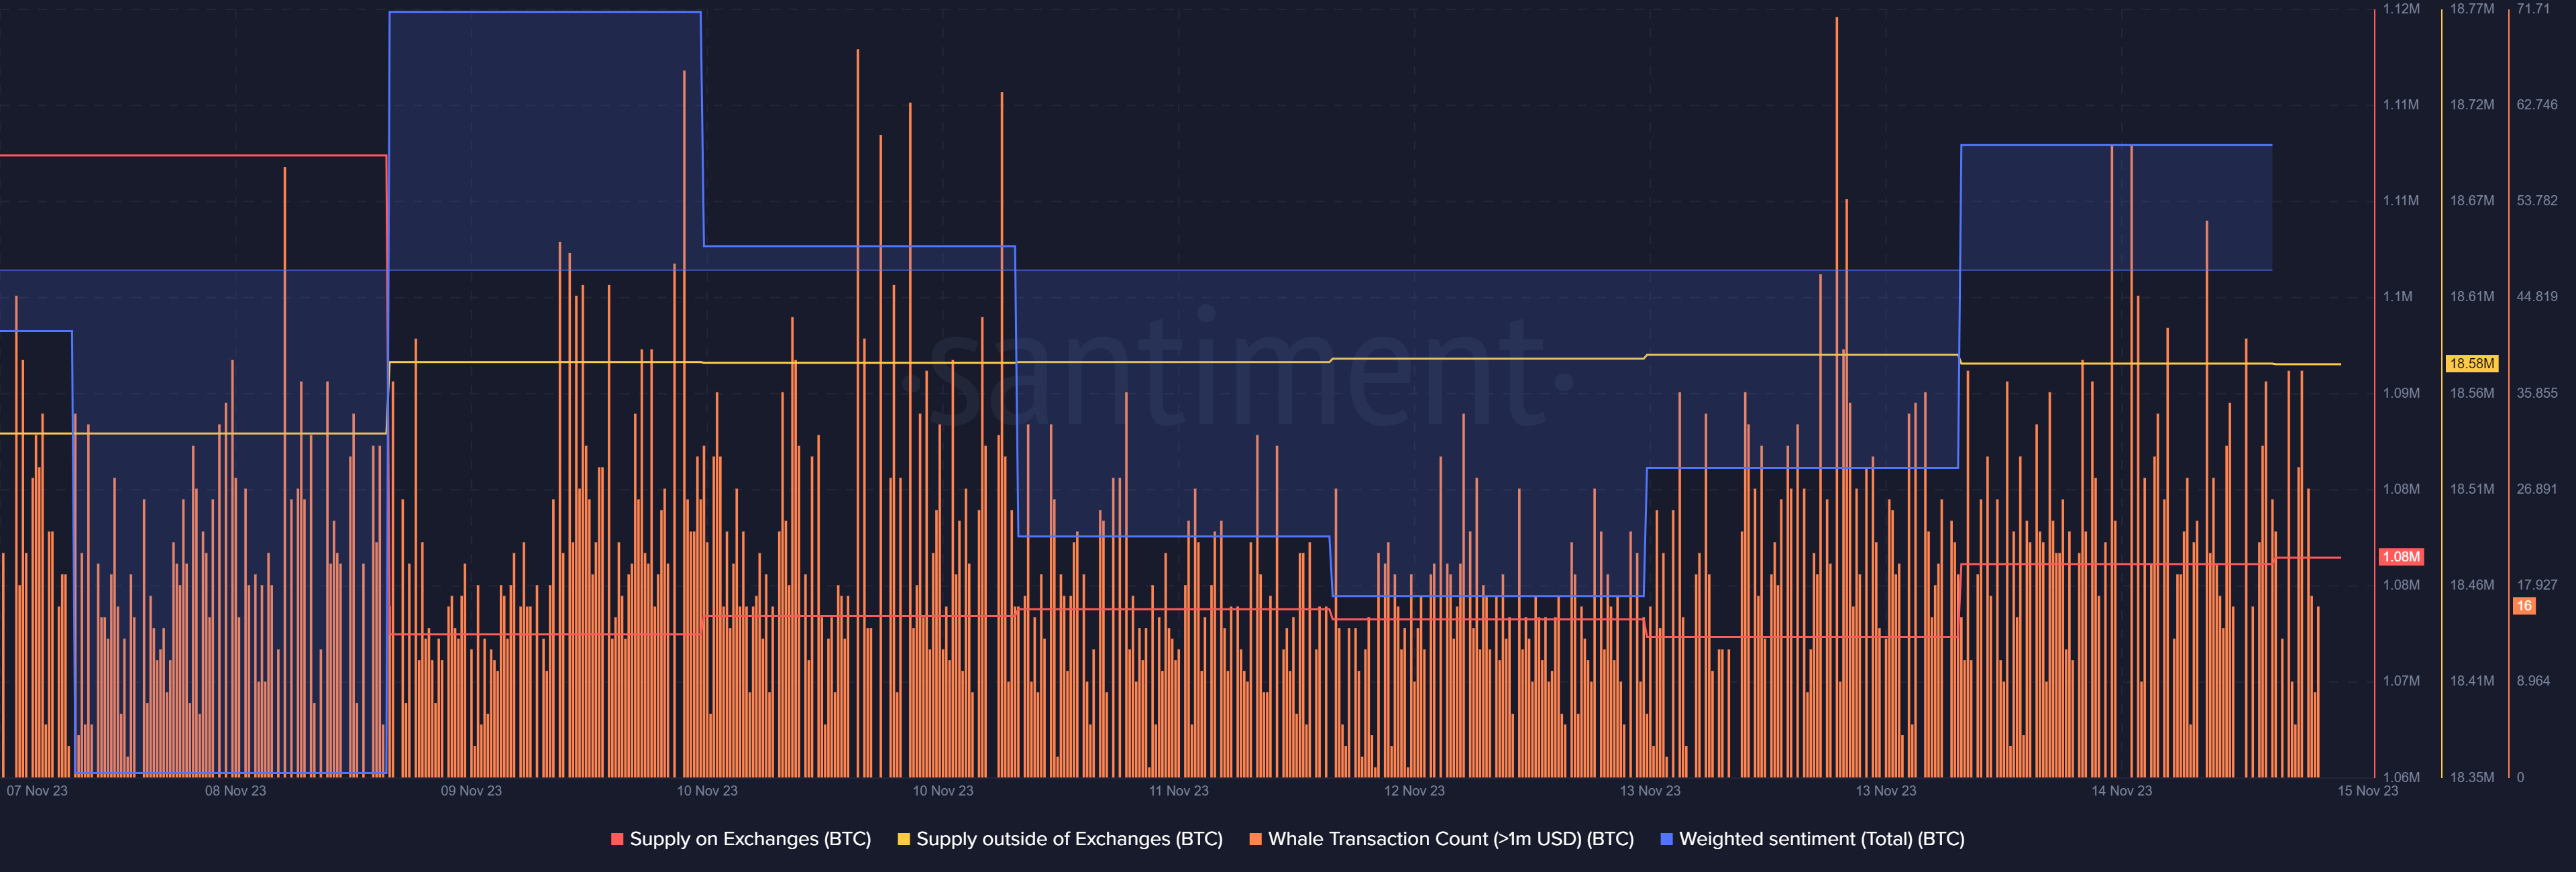
Source: Santiment
Is your portfolio green? Check the Bitcoin Profit Calculator
Upon checking BTC’s derivatives stats on Coinglass, AMBCrypto found out that the coin’s open interest dropped slightly along with its price.
Whenever open interest drops, the possibility of a trend reversal increases. Therefore, which direction BTC’s price moves in the coming days will be interesting to keep an eye on.