
- During the week, the new demand for BTC reached its highest level so far this year.
- However, the price decline below $37,000 has seen some coin holders distribute their BTC.
Leading cryptocurrency Bitcoin [BTC] has made an exceptional comeback this week, reaching a few yearly highs. On 15th November, the coin reclaimed the $37,000 price level after it recorded an intraday rally of 6% during that day’s trading session.
BTC closed the day at a high of $37,880 before witnessing a correction. The last time the coin traded at such a high was in May 2022.
At press time, BTC exchanged hands at $36,378, with a 2% value decline in the last 24 hours, according to data from CoinMarketCap.
As the coin’s price rallied to an 18-month high, its new demand also climbed. On-chain data sourced from IntoTheBlock showed that during the week, the coin’s adoption rate reached a yearly high of 67.62%.
This indicated that the week saw a significant increase in new market participants.
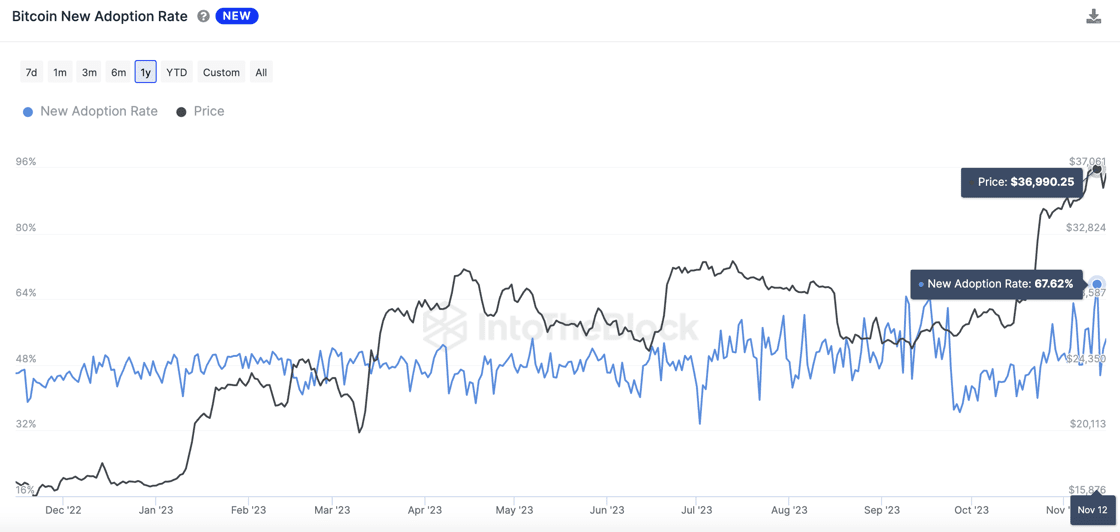
Source: IntoTheBlock
Additionally, information from the same data provider showed that the amount of BTC held by addresses with over 1,000 BTC also hit a new yearly high this week.
This cohort of BTC investors significantly reduced their BTC holdings following the collapse of Crypto lender Genesis and crypto trading firm Alameda Research in 2022.
However, they gradually increased their exposure to the leading coin at the beginning of 2023, which led their cumulative holdings to reach a high of 7.67 million coins this week.
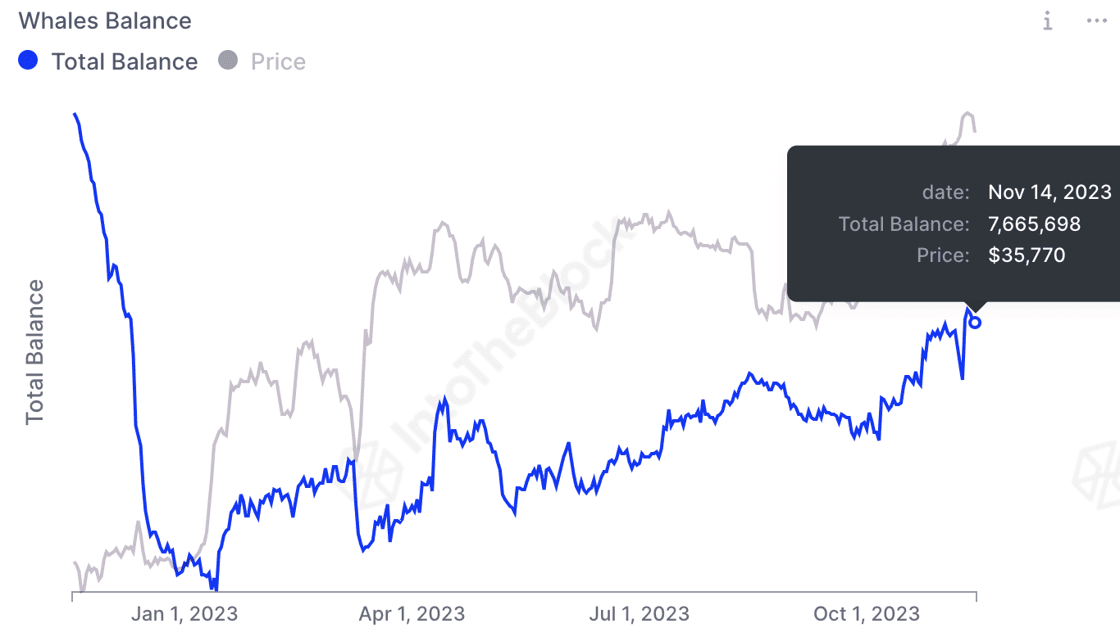
Source: IntoTheBlock
In the derivatives market, BTC’s options open interest exceeded $17 billion during the week, its highest level ever. BTC’s options open interest tracks the number of options contracts that have been traded but have not yet closed out or expired.
As of 17th November, BTC’s options open interest was $16.40 billion.
Are the bulls giving way to the bears?
While the week saw a surge in BTC’s network activity, an assessment of the coin’s movements on the daily chart revealed a significant decline in bullish momentum during the same period.
A look at BTC’s Moving Average Convergence Divergence (MACD) indicator showed that its MACD line crossed below the signal line on 12th November.
Referred to as a bearish crossover, the movement showed that the bears had regained control of the market, and the coin’s price might experience a decline.
Since the crossover, the indicator has posted only red histogram bars, suggesting that the downward pressure on BTC’s price might be increasing.
Is your portfolio green? Check the BTC Profit Calculator
Also, while they rested above their center lines at press time, BTC’s Relative Strength Index (RSI) and Money Flow Index (MFI) chased new lows during the week. At press time, the coin’s RSI was 59.44, while its MFI was 59.42.
The persistent decline recorded by these indicators signaled a preference among coin holders to sell their BTC rather than make purchases.
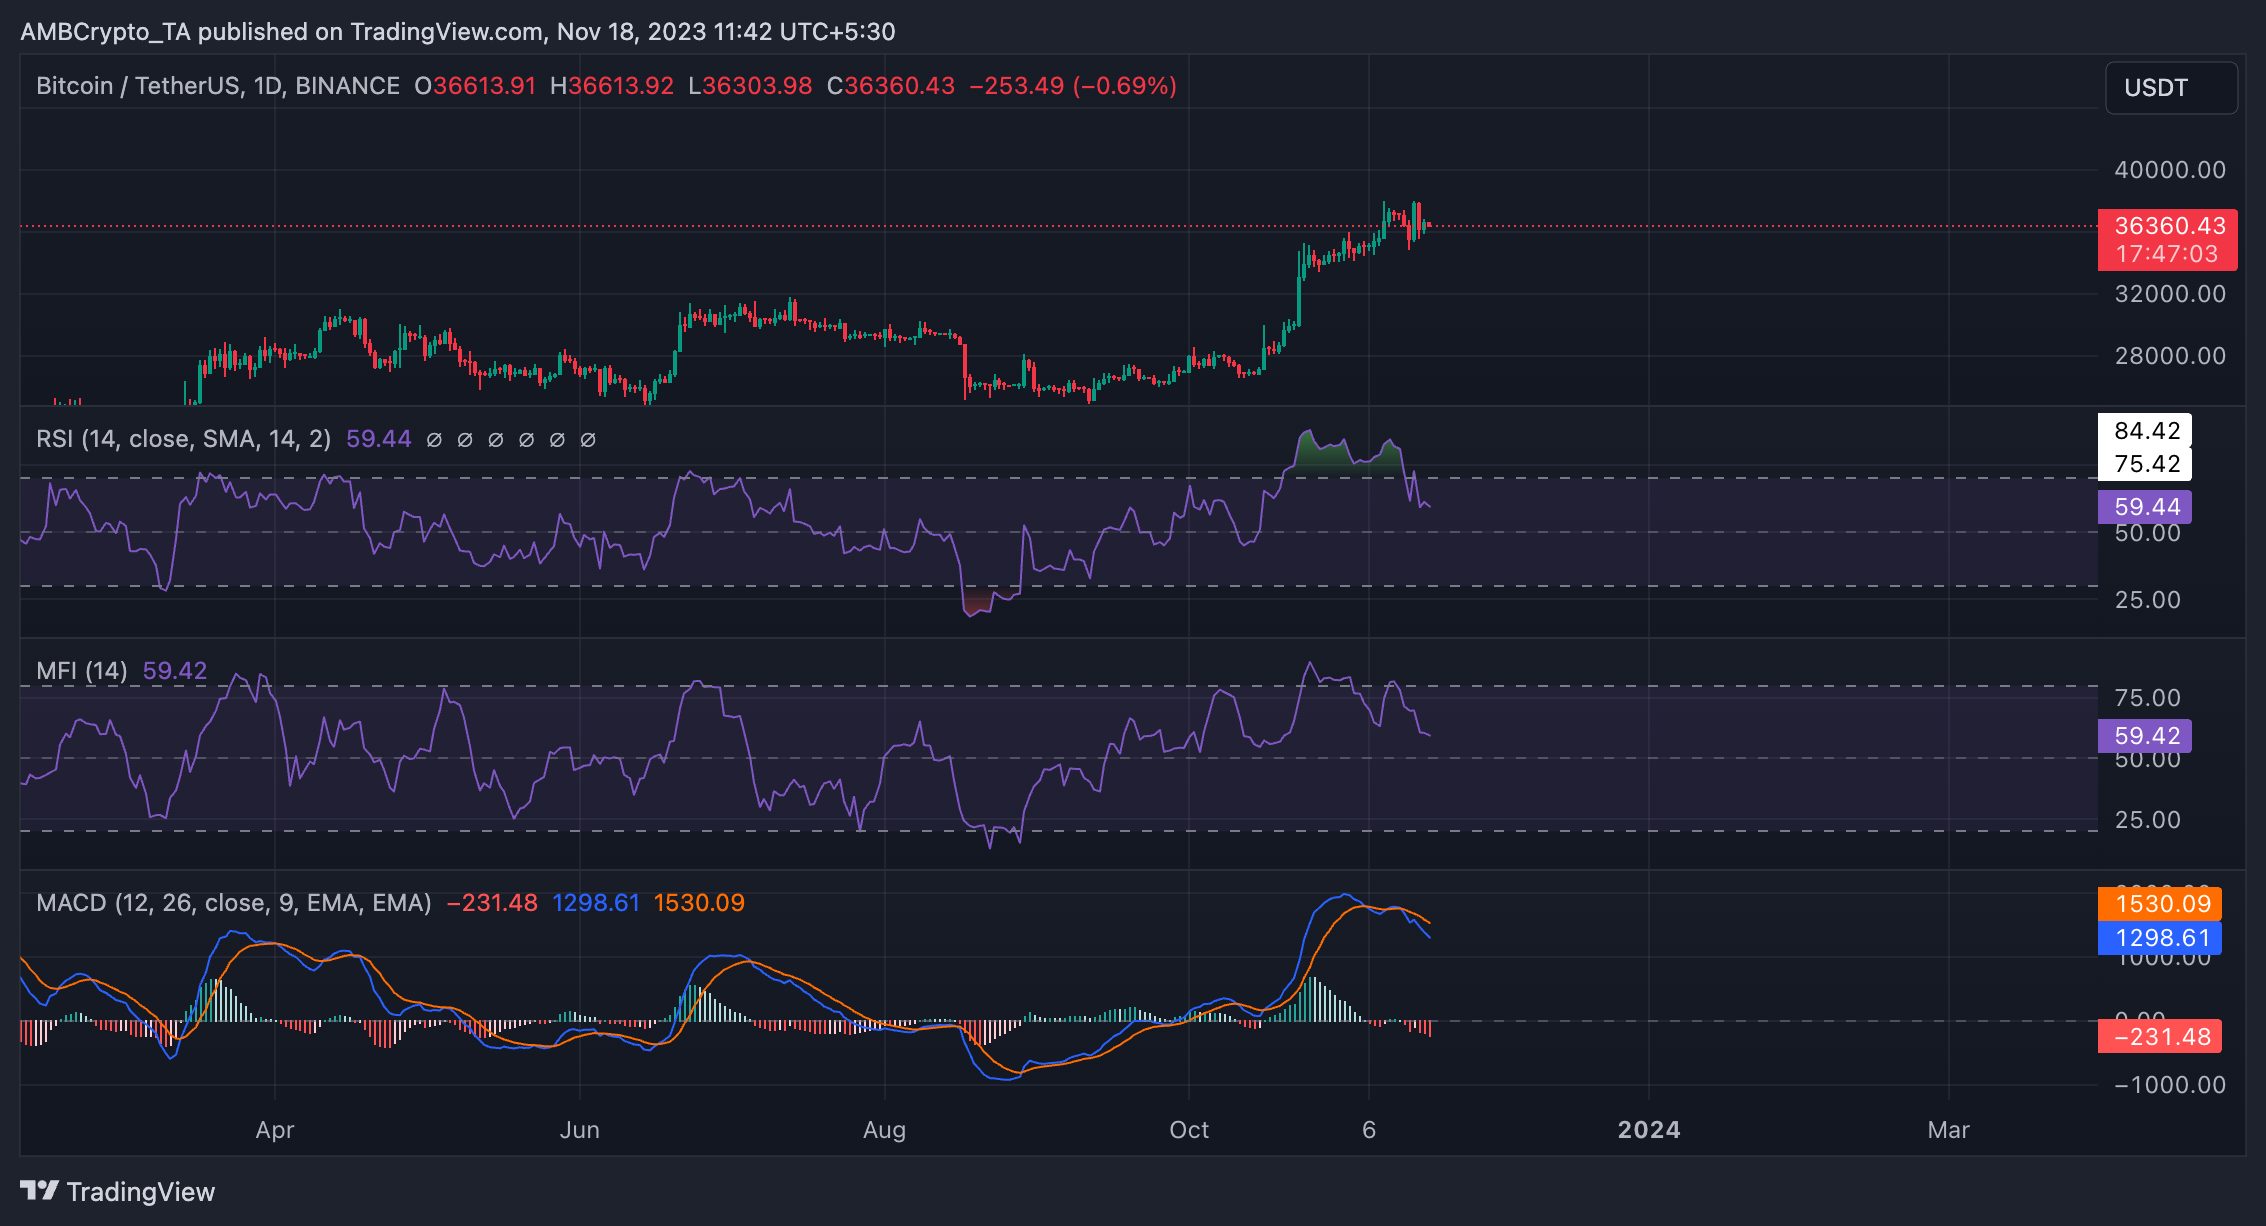
Source: BTC/USDT on TradingView