- The Bitcoin-NASDAQ 100 correlation has dipped to its lowest in months.
- BTC and NASDAQ 100 remain in a strong bull trend.
Over the past few weeks, Bitcoin [BTC] has experienced a varied price trend. This trend has influenced its correlation with stock prices, as a recent chart illustrates.
The report from Kaiko noted that the correlation between Bitcoin and the NASDAQ 100 has reached its lowest point in recent months. The observed chart showed that this correlation declined to around 13%.
What the NASDAQ 100 and Bitcoin correlation are
The NASDAQ-100 is a stock market index comprising 100 of the largest non-financial companies on the Nasdaq stock exchange.
Recognized for its emphasis on technology, it encompasses companies across diverse sectors such as technology, healthcare, consumer discretionary, and more. The NASDAQ 100 is commonly used as a benchmark for gauging the technology sector’s performance.
A correlation of 13% between Bitcoin and the NASDAQ 100 signifies a very weak or nearly negligible positive correlation.
The positive correlation coefficient implies that, on average, when BTC moves in a particular direction, the NASDAQ 100 tends to follow suit.
However, the low magnitude of 13% indicates that this tendency is weak. Nevertheless, this situation may offer an opportunity for investors to diversify their portfolios.
How Bitcoin and the NASDAQ 100 have trended
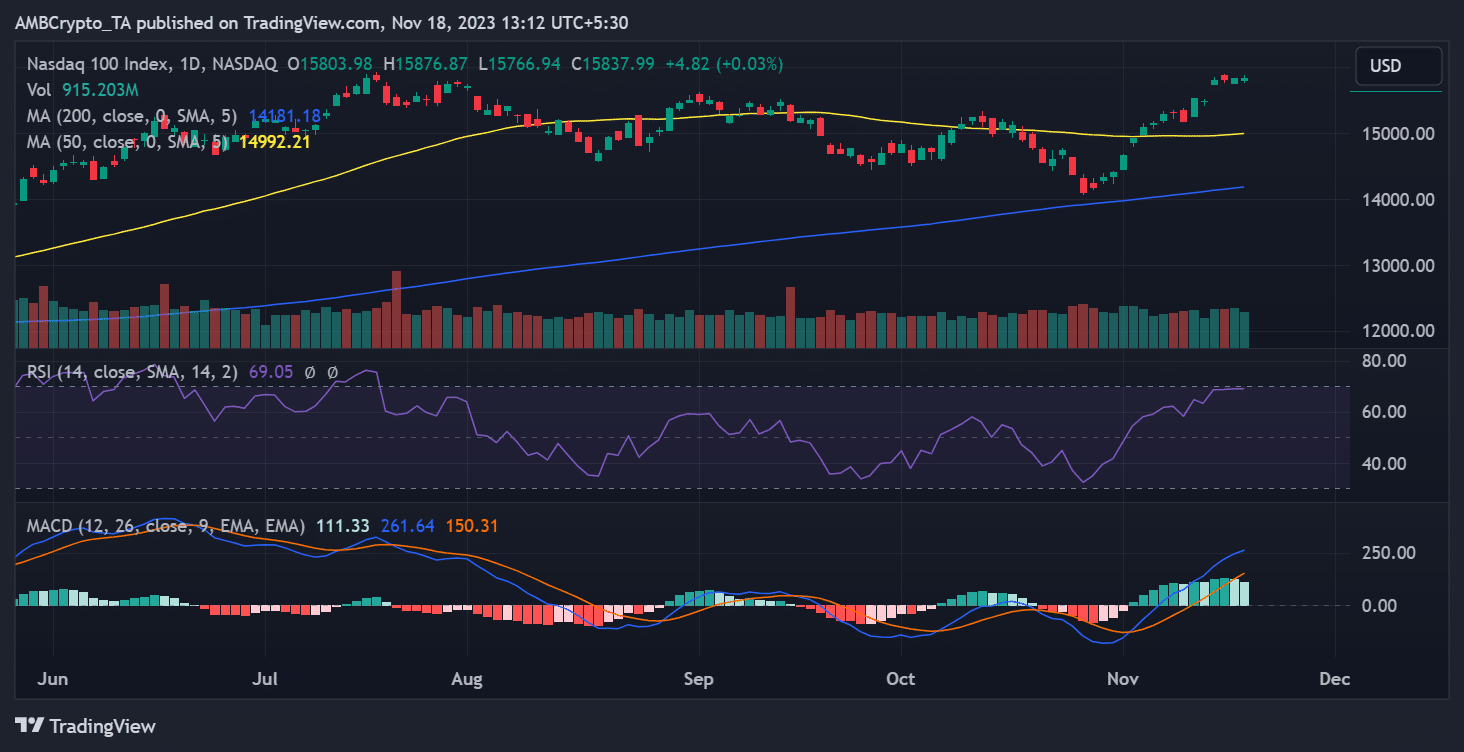
An examination of the daily timeframe chart by AMBCrypto revealed that both Bitcoin and the NASDAQ 100 were in a bull trend. However, a more detailed analysis indicated their respective gains and losses fluctuations.
According to the Bitcoin daily timeframe chart, it experienced a notable decline in price over the past seven days.
The chart depicted a 15th November reprieve marked by an over 6% price increase. Unfortunately, this rebound was short-lived, as it witnessed a loss of around 4% in value the following day.
Despite these fluctuations, Bitcoin managed to keep its price above $36,000. At the time of this writing, it was trading at around $36,400, reflecting a less than 1% decrease in price.

Read Bitcoin (BTC) Price Prediction 2023-24
Additionally, AMBCrypto’s examination of the NASDAQ 100 on a daily timeframe revealed a consistent uptrend with fewer losses. The chart showed a smoother pattern of price trends, indicating a robust bull trend.
At the time of this report, the Relative Strength Index line suggested that the NASDAQ 100 was nearing the overbought zone.