
Disclaimer: The findings of the following article are the sole opinion of the writer and should not be taken as investment advice
Bitcoin SV, like many altcoins in the market, was undergoing a consolidation on the charts after a recent surge of 10-12%. Unlike many, BSV’s charts pointed to a bullish consolidation pattern over a long-term timeframe.
On the medium to short-term time frame, the price will experience sideways movement, until the pattern gets filled. Following this, a bullish breakout can be expected to take place.
Bitcoin SV 1-day chart

Source: BSVUSD on TradingView
The one-day chart, as previously mentioned, formed an ascending triangle formation that pointed to a bullish breakout bias.
The target, according to this pattern, could range anywhere between 9% to 33% from the base of the triangle. The immediate resistance was 9% away at $198.60, which is the first target, the second resistance after this was 21.82% at $218.70. The last target, which is a greedy target, was 33% away at $238.90.
The targets can be set depending on the risk one is willing to take. Overall, the current setup is bullish for BSV. However, a long position can be determined by a successful breakout above the base of the triangle.
A stop-loss of $159.62 would be wide enough to absorb any volatility thrown BSV’s way.
The rationale behind this long position, in addition to the ascending triangle pattern, includes,
- A bearish divergence between the price and RSI and price and OBV.
- A bearish crossover on the Stochastic RSI on a daily time frame.
Short-to-mid-term scenario
While the long-term scenario seemed achievable, the short-term scenario can deviate from the pattern and a downward breakout might hurt the performance of the pattern. At press time, the price was heading towards the bottom of the triangle and we can expect the price to bounce from this low and head towards its end goal – breakout of the triangle.
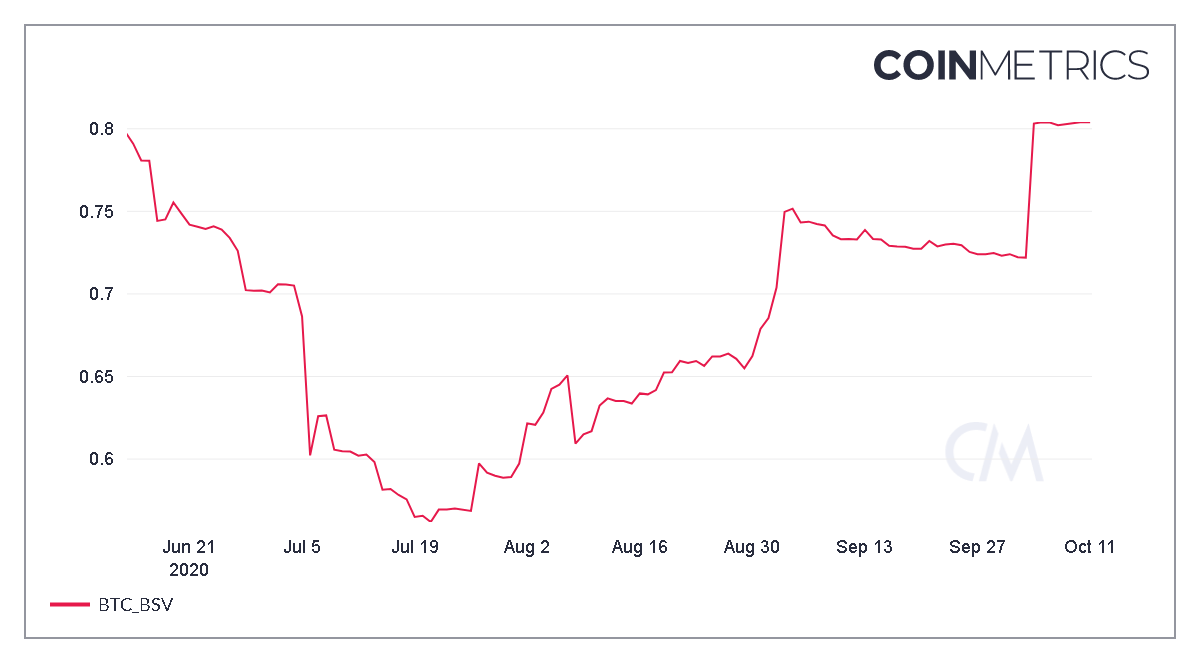
Source: Coinmetrics
Bitcoin SV’s 90-day Spearman correlation with Bitcoin seemed to be on the rise too. Since the start of October, the correlation has risen from 0.72 to 0.80, a stark increase. This could hurt the pattern, and its breakout, should Bitcoin head lower at the time of the breakout. Hence, care should be advised with the current long position.