Ethereum short-term Price Analysis: 29 September

Over the past 12-hours, Ethereum has dropped below the resistance at $360 in the charts but continues to consolidate within close proximity to $357. At press time, the asset seemed to hold its own but it might face a minor bearish pullback if the price pattern takes a decisive turn.
With a trading volume of $14 billion over the past day, Ethereum registered a market cap of $40.34. In spite of the drop, the asset was up by 4.48% over the past 24 hours.
Ethereum 1-day chart

Source: ETH/USD on Trading View
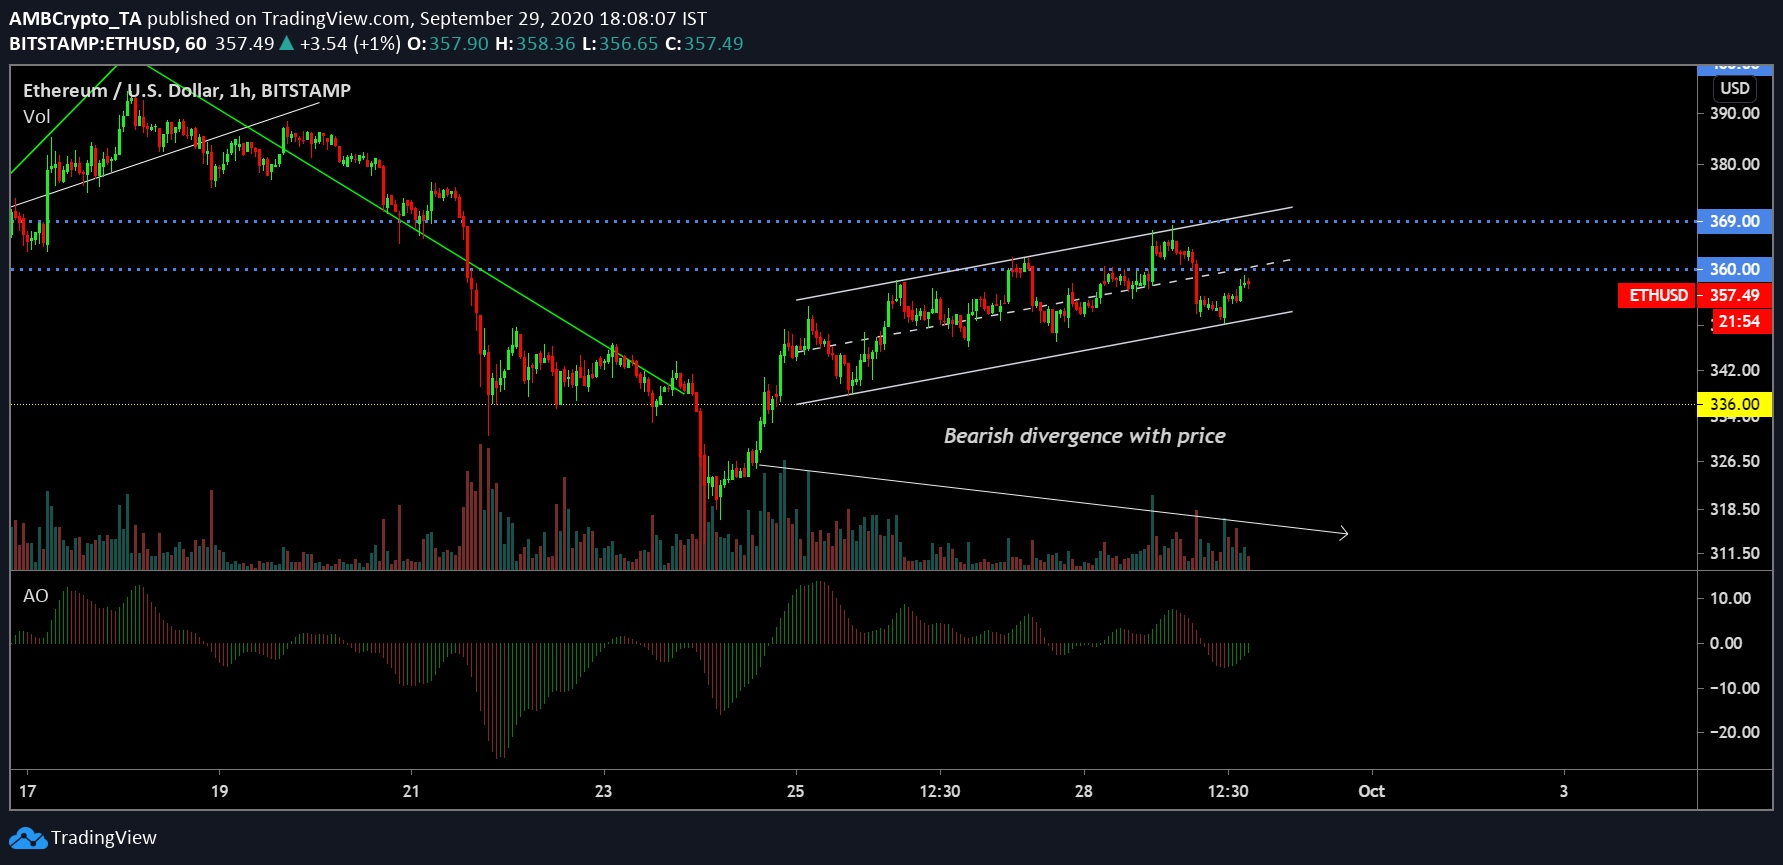
Since 25 September, Ethereum’s valuation has facilitated movement within the current ascending channel, with the price dropping under the average over the past 12-hours. Right now, while the value remains under $360, the pattern hasn’t been breached yet. While an ascending channel indicates a bearish breakout, the divergence with the trading volume more or less confirms it at the moment.
While the price might attain another re-test at $360, traders should brace themselves for a decline under $350 over the next few days.
Surprisingly, the Awesome Oscillator was bullish in the chart but the momentum was slowly diminishing in the charts.
Ethereum 30-min chart

Source: ETH/USD on Trading View
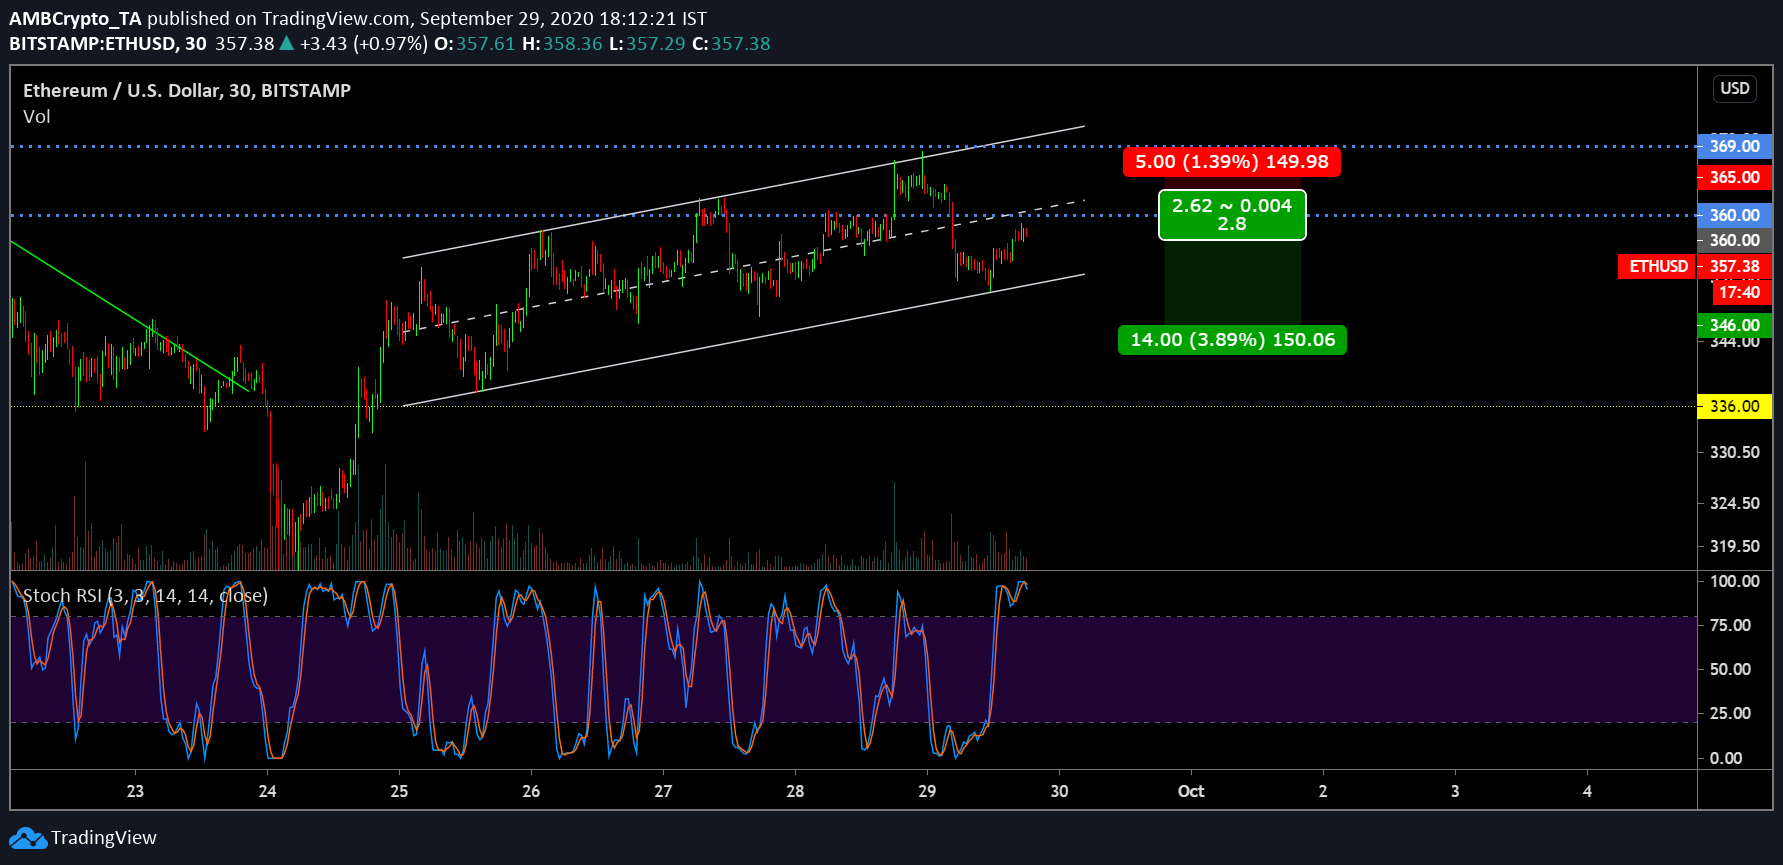
While an immediate drop might not take place, the Stochastic RSI suggested that a breakout downwards is fairly due at the moment. With the blue line crossing under the signal line at an overbought region, the breakout downwards seems inevitable.
Keep the current recovery in mind, a short-position can be opened by keeping an entry position at $360. However, the stop-loss should be placed at $365 because any breach above $365 would possibly test $370 as well. Profits can be attained at $346 but the current trend is still extremely volatile hence avoiding the current price movement would not be a bad move either.


