BAT, Tron, Litecoin Price Analysis: 28 August

After weeks of bullish movement, it would seem that the larger crypto-market has come to a grinding halt, with bears ruling the roost now. When Bitcoin gradually fell on the charts after having failed to sustain a beach of $12k, so did the market’s altcoins. At the time of writing, most of these alts, including the likes of Litecoin, Tron, and BAT, were noting corrections of their charts.
Litecoin [LTC]

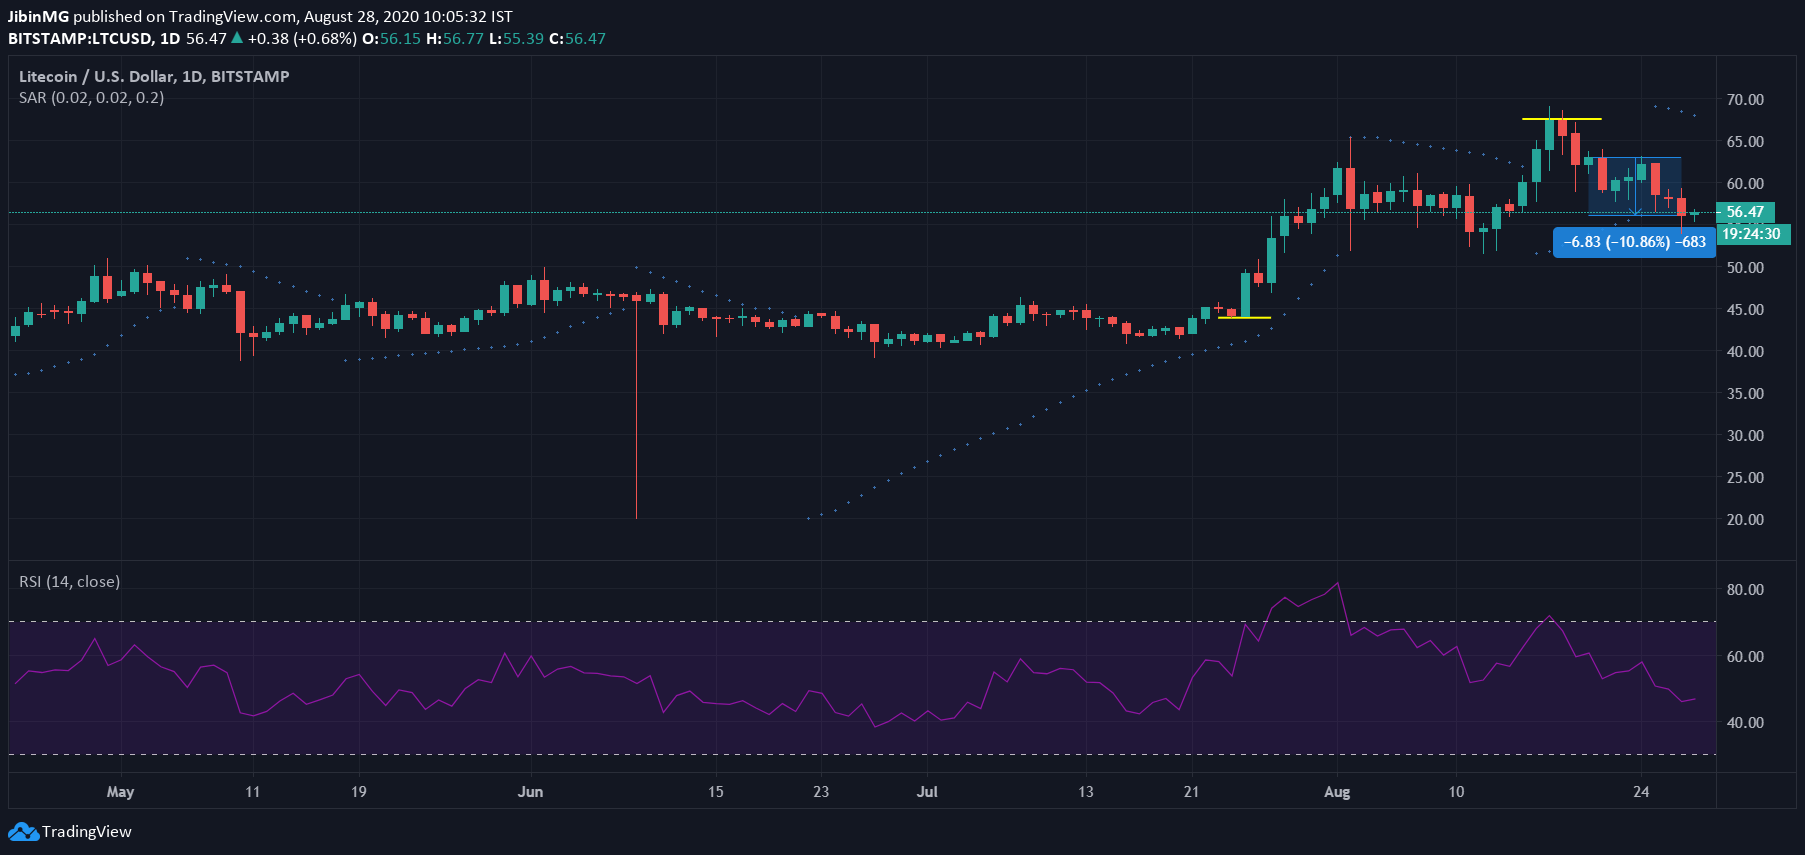
Source: LTC/USD on TradingView
Litecoin, the silver to Bitcoin’s gold, looked all set to hit new heights on the back of the mini-surge in mid-August. However, this wasn’t to last as soon, LTC fell on the back of Bitcoin’s own depreciation on the charts. In fact, at the time of writing, LTC was down by over 10% over the past 7 days, with corrections pulling the crypto back to the levels it was trading at right before the aforementioned surge.
The effect of the market’s correction wave was evident in Litecoin’s technical indicators as while the Parabolic SAR’s dotted markers were well above the price candles and implied bearishness, the Relative Strength Index continued to drop towards the oversold zone on the charts.
While many in the community continue to be skeptical about the long-term success of Litecoin, Charlie Lee doesn’t feel that way. In fact, in a recent tweet, Lee, pointing to recent developments such as Litecoin Visa Card, Grayscale Litecoin Trust, and exponential hikes in total addresses, transactions, and hashrate, claimed that Litecoin had great fundamentals.
Tron [TRON]

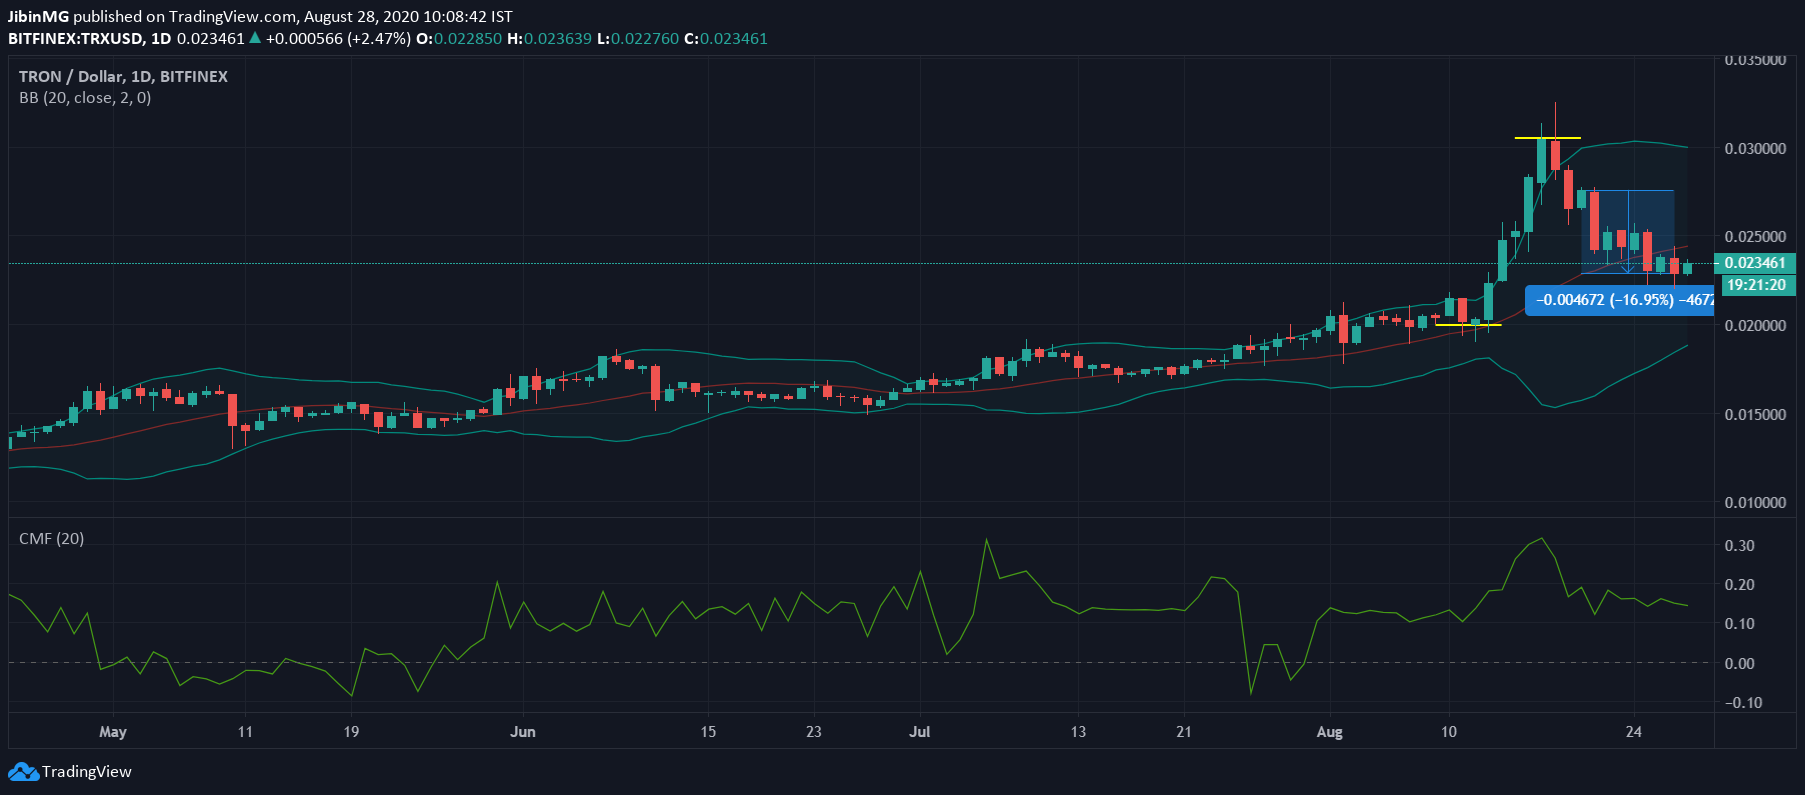
Source: TRX/USD on TradingView
Tron [TRX], ranked 15th on CoinMarketCap at the time of writing, like Litecoin, noted an exponential surge on the charts in mid-August. However, like LTC, TRX too fell when Bitcoin did, owing to which its price performance since has been badly affected by strong waves of corrections. It must be noted, however, that at press time, TRX was still trading well above its July and early-August levels.
Over the past 7 days, TRX was down by over 16% on the charts, with the crypto some way off from breaching its nearest local top following the aforementioned corrections.
The scale of the depreciation was highlighted by the Bollinger Bands as the mouth of the same remained uniformly wide. However, interestingly, the Chaikin Money Flow remained consistent above 0.10 on the charts, a sign of capital inflows holding their own.
Tron was in the news recently after Tether shifted over $1 billion in USDT from the Tron blockchain to the Ethereum blockchain.
Basic Attention Token [BAT]

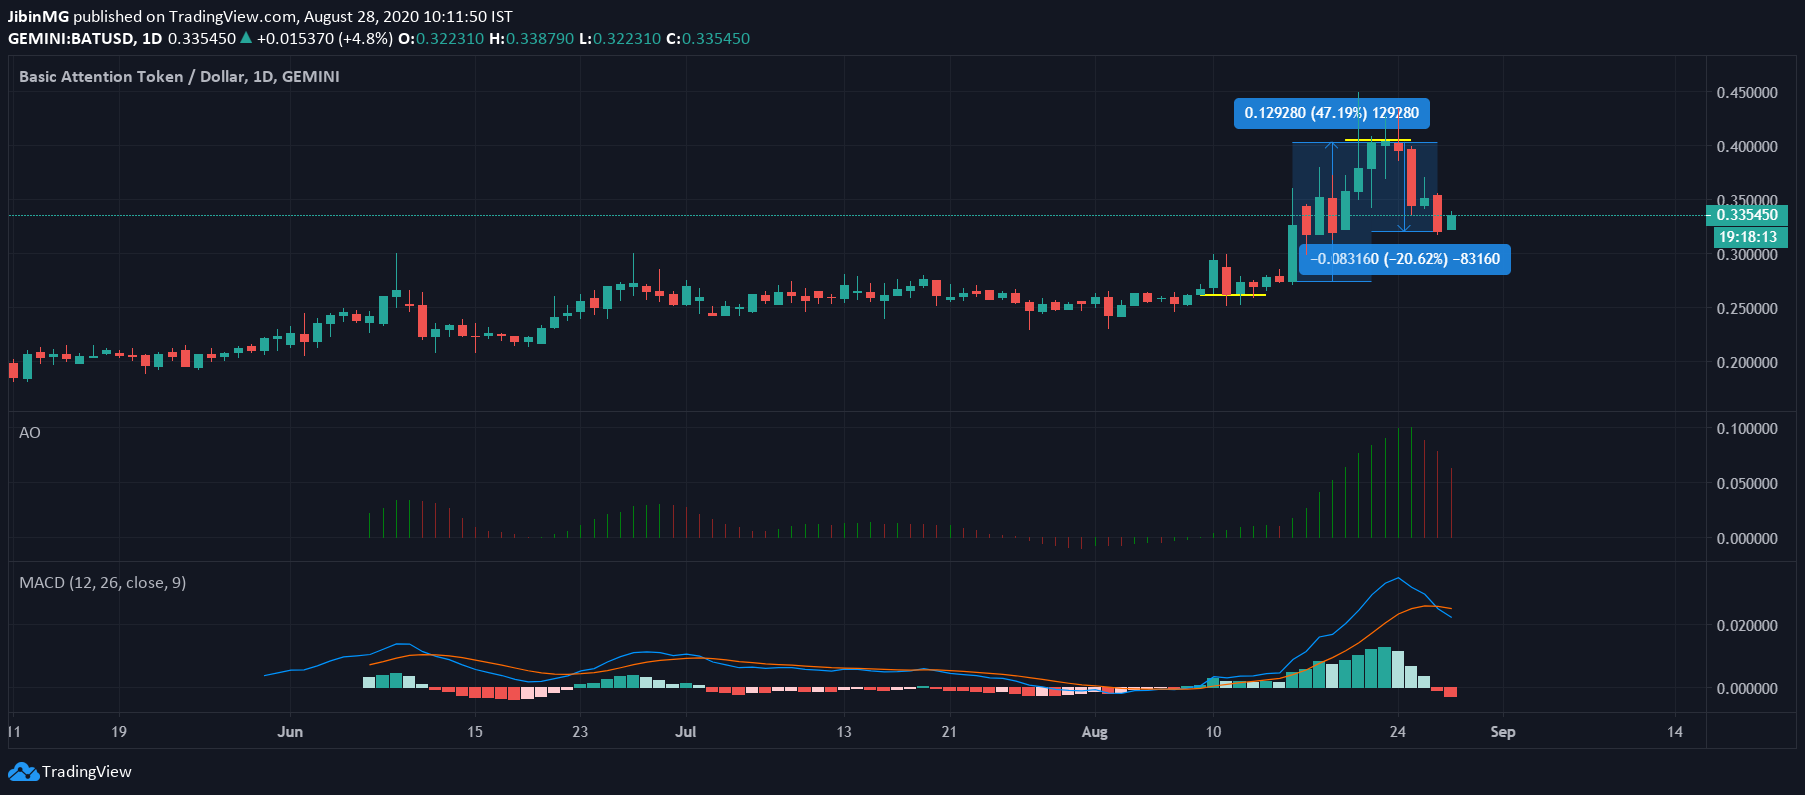
Source: BAT/USD on TradingView
Brave browser’s native crypto, Basic Attention Token aka BAT, was among the cryptos to fall on the charts after Bitcoin’s latest failure to breach the $12,000-mark. However, BAT’s movements in the month of August have been incredibly volatile, with corrections pulling down BAT’s value by over 20%. Here, it must be noted that the aforementioned fall came on the back of BAT climbing by over 47% on the charts – all within a span of just over 7 days.
While the Awesome Oscillator pictured falling market momentum, the MACD line had slid under the Signal Line at the time of writing following a bearish crossover.
