Ethereum Short-Term Price Analysis: 12th June

Disclaimer: The following price prediction should materialize within the next 24-48 hours.
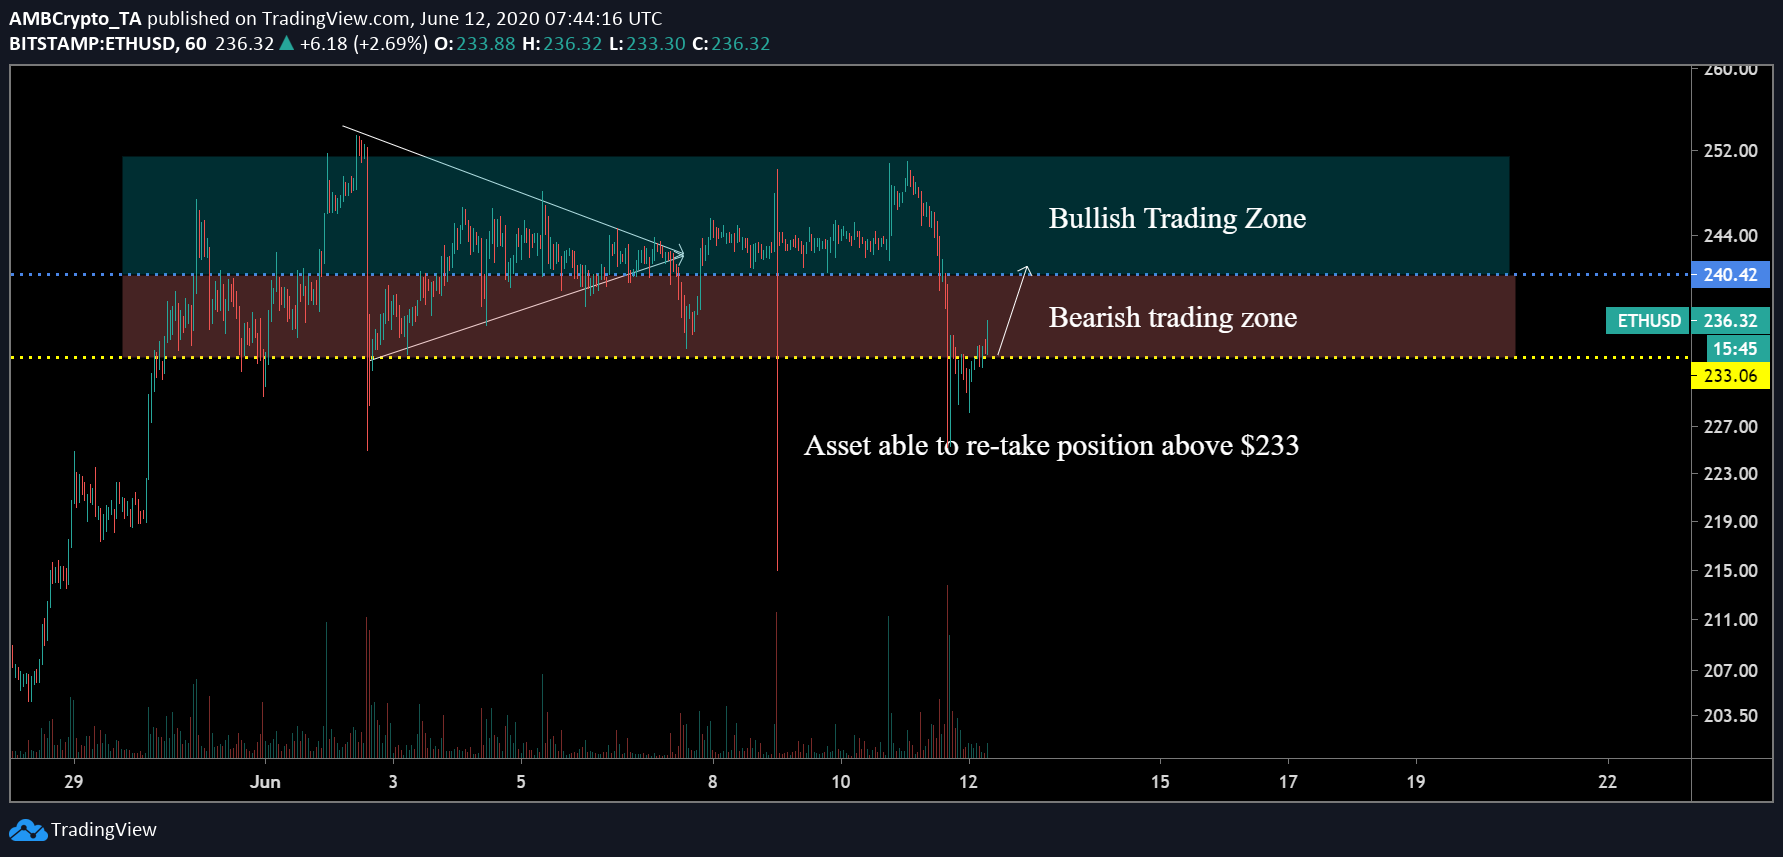
After testing the waters above $250 on 11th June 11:00 UTC, Ethereum faced a drastic turn of events, that might not have appeased its proponents. In a period of 14-hours, Ethereum’s valuation dropped all the way down to $225 from $251.
The estimated depreciation was close to 10 percent, which is its largest pullback in June. Due to an established presence of buying pressure, the token was able to rally back above $230, and its current valuation stood at $235.
Ethereum 1-hour chart

ETH/USD on Trading View
There are a couple of things that are imperative to Ethereum’s movement over the next 24-48 hours. Firstly, the 10 percent depreciation suffered yesterday was Ethereum’s first breach below support $233 in June. The largest altcoin has been able to deal with short-term adversity in the month, as a bearish breakout from a symmetrical triangle also did not shave much of Ethereum’s value.
Now, for a majority of the month, Ethereum has exhibited navigation above the $240 mark (bullish trading zone) but the recent collapse led to ETH plummeting all the way down to $225. Now, the lower range position was extremely short-lived as the bulls were able to drive the price back above $235 at press time.
For Ethereum to maintain its bullish propagation, a breach above $240 within the next 24-hours is highly essential. Considering the asset is able to surge above the immediate resistance, it would be fair to say Ethereum’s bullish momentum escaped the short-term onslaught.
Additionally, it was also observed that over the past 24-hours, around 374 Ether in volume was liquidated. Now, this could actually strengthen ETH’s market because it removes potential sellers; who might have liquidated existing longs by selling.

ETH/USD on Trading View
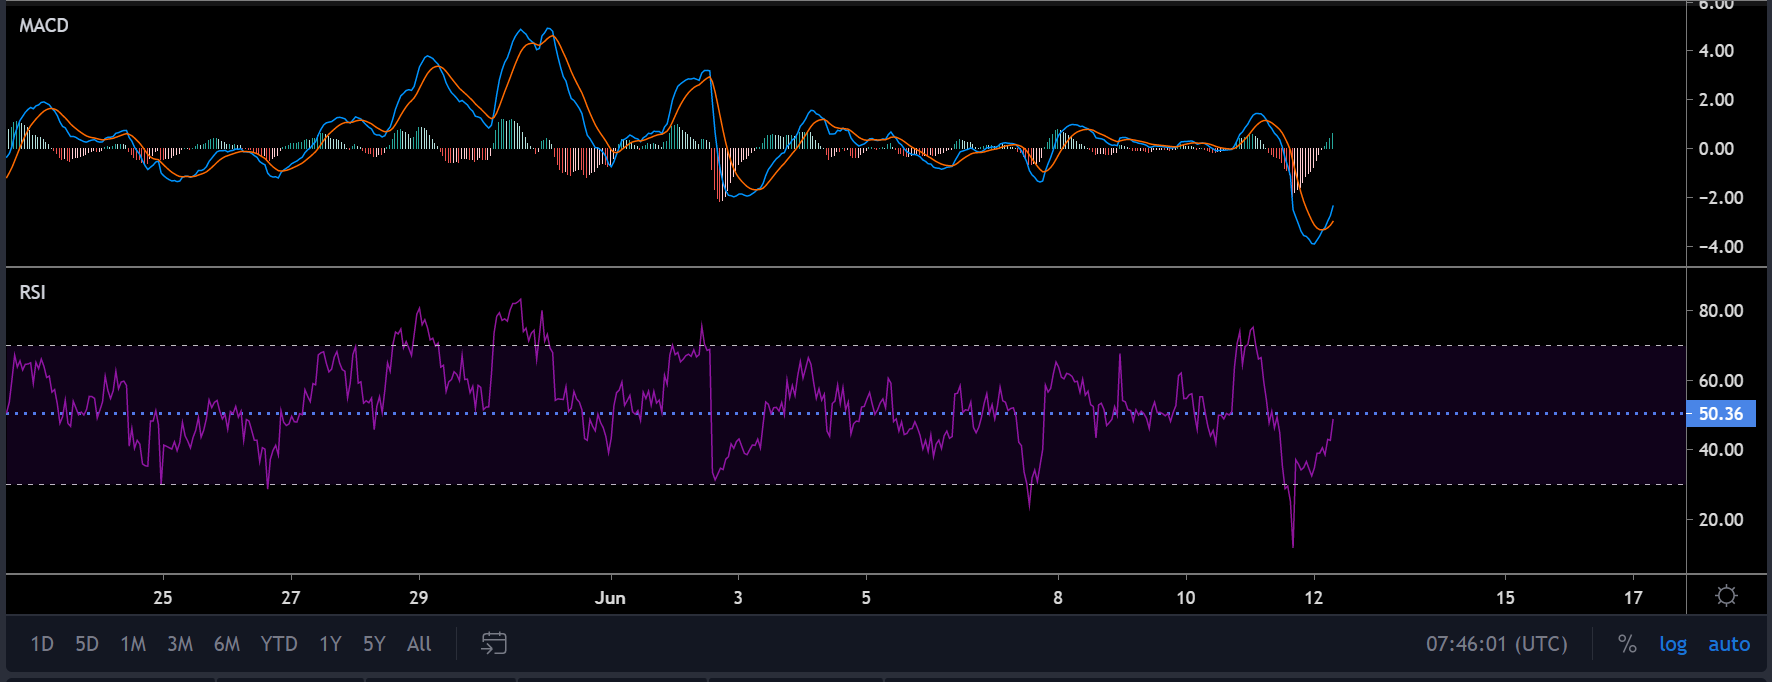
Speaking about Market Indicators, MACD was quick to respond as the MACD line had completed a bullish turnover with the signal line at the time of writing. Relative Strength Index or RSI faced a little resistance at the 50 mark, and the buyers attempted to take back the momentum from the high selling pressure.
Conclusion: Strong bullish evidence might indicate Ethereum’s recovery above $240 within the next 24-48 hours.


