
So far, 2020 has been a tumultuous year for Bitcoin with the price heading close to $15,000. Since this point, the price has been on a rocky journey, visiting the $3,000 level, hitting $10,000, and dipping as low as $8,100 recently. Considering the month of April has the highest average volatility, and with halving around the corner, things will be much more volatile.
Bitcoin’s Daily
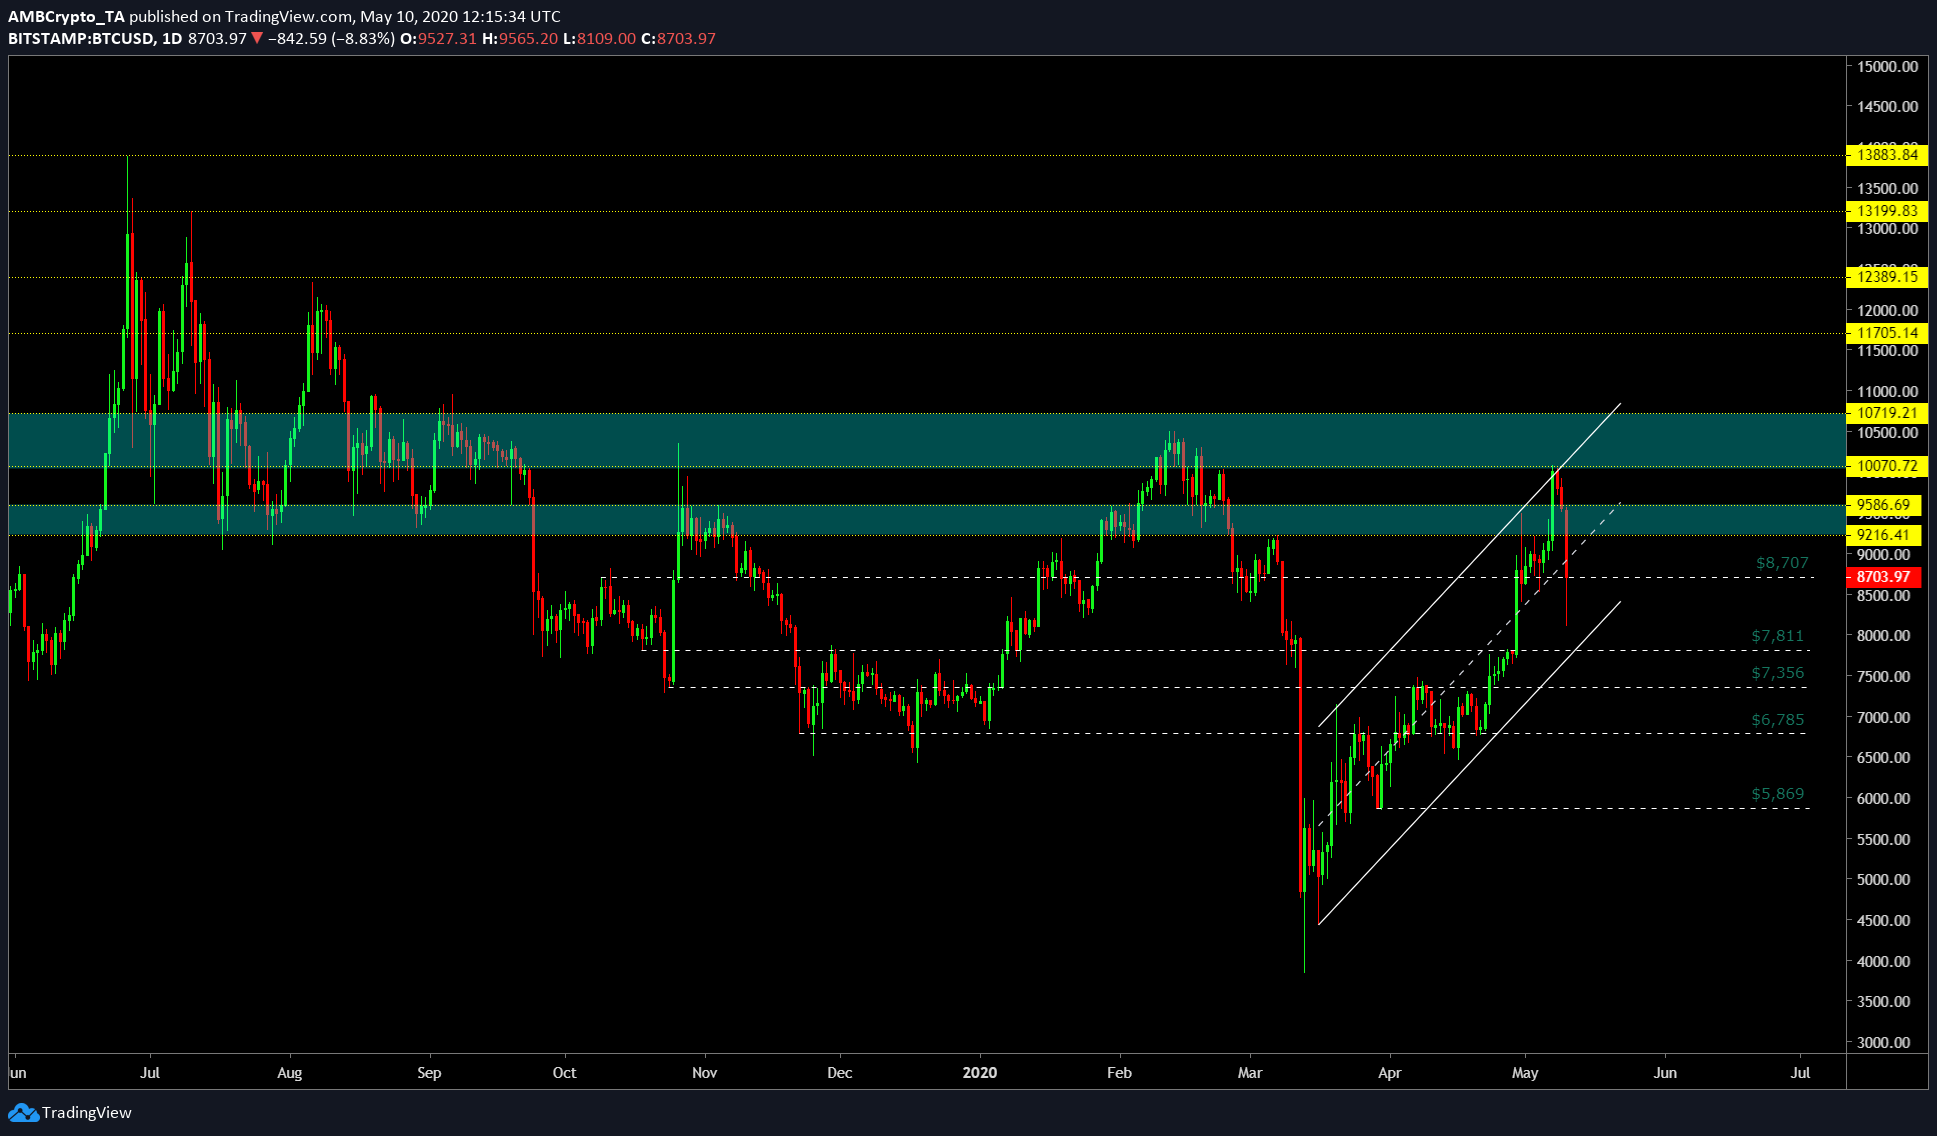
On a daily time frame, Bitcoin seems to have developed a parallel channel pattern with a positive slope. These patterns represent a bearish outcome for Bitcoin post halving, at least for the short term. At press time, the May 10, drop took the price down to $8,100, which is close to the lower line of the parallel channel. To complete the pattern, the next candle or perhaps, today’s candle could dip below the current support [$8,707] and touch the bottom line, which is positioned at $7,811.
BTCUSD TradingView
The breakout might take place in the next few days, however, identifying the extent of the breakout would better position traders to take profits and not overextend. The technicals indicate that the price would head to $5,869, but it seems too soon to predict that. However, the potential levels that bitcoin could find support include $7,811, the point at which the price will touch the bottom line of the channel.
Following this, the level ranging from $7,356 to $6,785 seems plausible. This is the range where Bitcoin spent almost two months in 2019 and a small part of early 2020. Hence, this range is strong support, meaning, Bitcoin will probably end its bearish breakout from the pattern at this level.
In an extremely bearish scenario, the price might head as low as $5,869. This could be possible if halving will take out a lot of miners causing the hash rate to drop and create a cycle, in which, the price gets affected and drops.
Bitcoin’s Weekly

BTCUSD TradingView
The weekly chart for Bitcoin showed an interesting rejection at a sloping resistance that extends as far back as 2017. This goes to show that the price wasn’t primed for a rally like 2017-style. However, for now, the rejection opens up possibilities of lower treading price for the next 2-3 months, perhaps, 4 months, depending on how fast the price heads lower.
As seen above, the only thing preventing the price heading lower is the 21 WMA which is supporting the price. On a bearish case, if the 21 WMA gives away, the support that will hold the rampaging bears stands at $6,801, a level discussed in the daily time frame. The “ping arrow” shows the price trend of BTC in the next few months should it continue to head lower.
Conclusion
The following levels are critical in determining where BTC will head – $8,707, $7,811, $7,356, $6,785, and $5,869. An extremely bearish scenario on the weekly time frame showed that the price would head to $6,801. It should also be noted that there is a chance for the price to bounce at the 21 WMA and head higher, retest the sloping resistance.