Analysis
XRP’s restricted price may notice a boost with breach of ascending triangle

XRP’s price was restricted between $0.2600 and $0.2400, in light of various developments that occurred ints ecosystem.
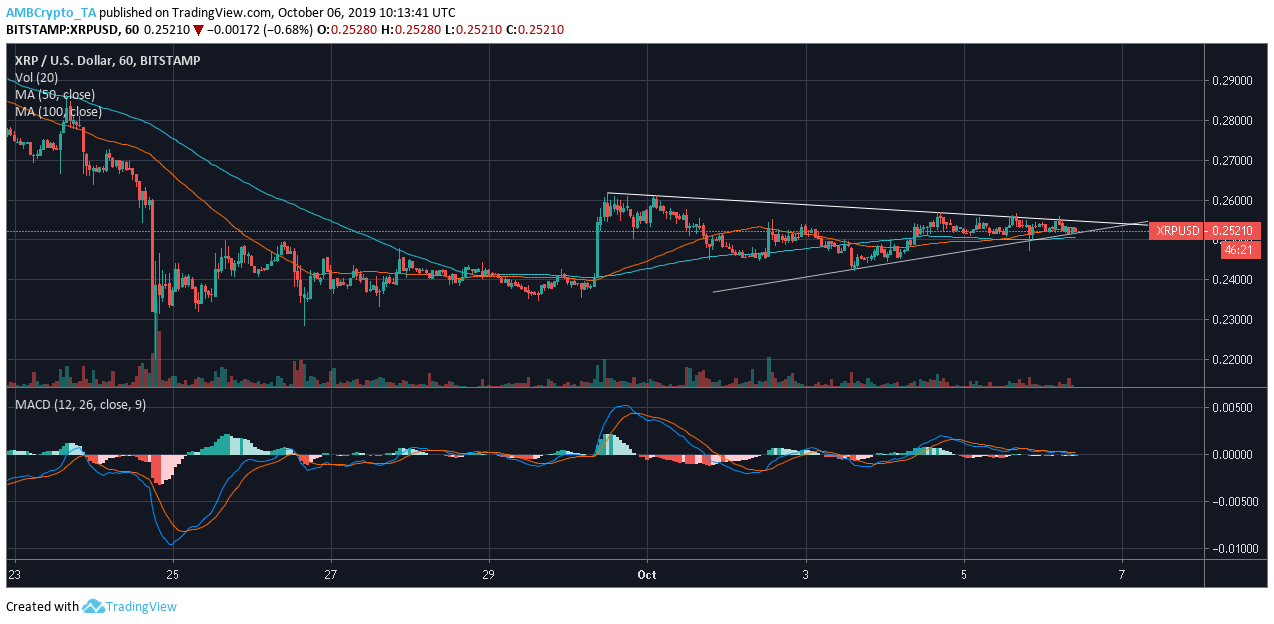
1-hour

Source: XRP/USD TradingView
The 1-hour chart of XRP exhibited the formation of a symmetrical triangle, that extended from the end of September to October. It was characterized by two converging trend lines connecting a series of lower highs at $0.2424, $0.2441, and $0.2498 and higher lows at $0.2618, $0.2610, $0.2568, and $0.2549. These trend lines, converging almost at an equal slope, could break out on either side of the market.
However, MACD indicator suggested a dominant bearish market after a recent crossover with the signal line, reversing the bullish trend. While the 100 Moving average indicated a bullish market as it rested under the candlesticks.
4-hour
Source: XRP/USD TradingView
A bullish wave may hit the XRP market as the formation of an ascending triangle was underway. This bullish pattern was created by a horizontal resistance at $0.2554 and a rising trendline, marking lower highs at $0.2192, $0.2356, and $0.2462. Breakout is likely in the upward direction. As the price consolidates within the two trend line a breakout may be imminent.
However, the moving average and the indicator tell a different story. 100 moving average showed dominance in the XRP 4-hour market as it was over the candlesticks, making it a bearish trend. MACD indicator affirmed this bearishness in the market with a recent crossover.
Conclusion
According to the four-hour chart of XRP, a bullish breakout in the bearish market may be taking place, as the current resistance of XRP was marked at $0.2600 and support was strong at $0.2356 with the asset being valued at $0.2537.

