Analysis
Will XRP’s bad luck continue? Price may revisit $0.208 and head lower soon

XRP goes where Bitcoin does. In fact, this is true for most cryptocurrencies. However, this correlation spikes up when there’s a massive surge/drop in Bitcoin’s price. and could either be good or bad. The surge for XRP on April 30 was due to Bitcoin’s surge, hence, it was an advantage for XRP and its holders.
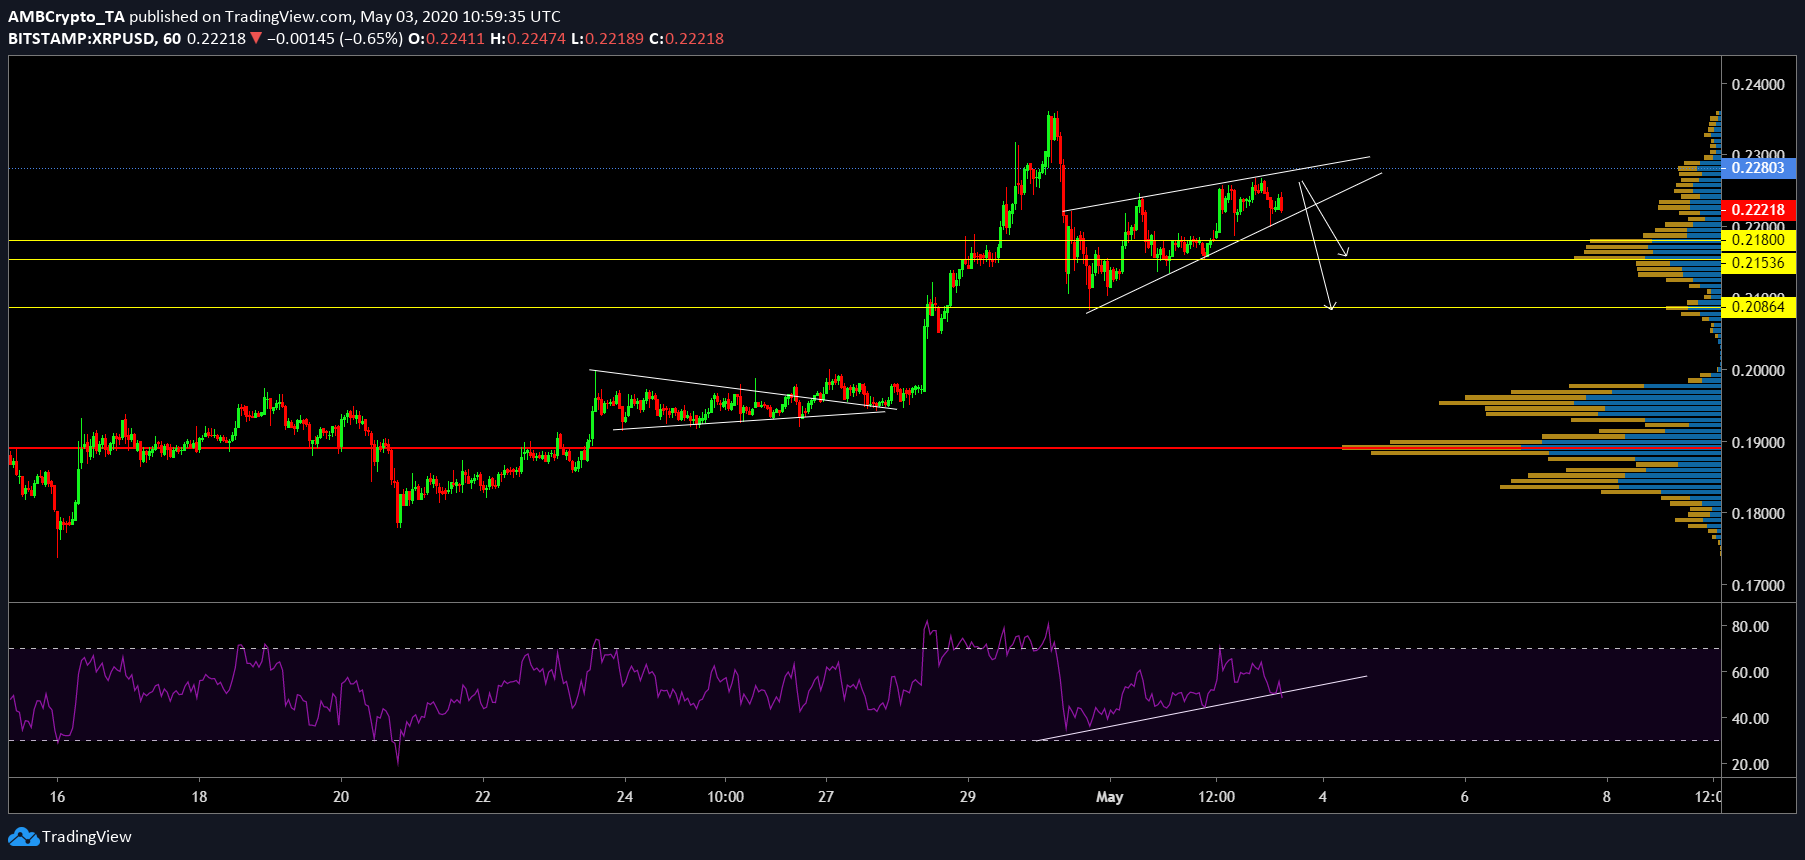
XRP was priced at $0.223 with a market cap of $9.82 billion. The coin has had a 2.43% surge in the last 24 hours, however, it will be undone soon with the formation of a bearish pattern. On the 1 hour chart, XRP has formed a rising wedge indicating a bearish breakout soon.
One-Hour

XRPUSD TradingView
As mentioned, the bearish pattern has been forming for over 3 days now and has come very close to the breakout point. After the breakout, the coin’s targets include a range extending from $0.218 to $0.2153. This is the first target and is a 3% drop from the current value. However, if bears push through this target zone, the next target would be $0.2086, which is a 6% drop from the current price level.
All of the above-mentioned supports are in line with VPVR indicator, which showed high volume action in the last week or so. As for the relative strength index [RSI], it is showing bullish bias aligned with the price. In a bearish case, if the RSI does manage to form a low below 35, then it would create a bearish divergence.
At press time, RSI has formed a low at 48.25, very close to the neutral zone. If the sellers overwhelm the buyers at this point, then the breakout will occur, pushing the price to the said targets.
XRP’s correlation did reach a peak recently, and if this continues to grow, then the drop would either be disastrous or just a shrug, depending on if the coin moves with or against Bitcoin.
Conclusion
The bearish rising wedge will push the price of XRP, especially with BTC drop slowing and trudging sideways. To sum it up, the targets include a zone ranging from $0.218 to $0.215 and $0.2086.
