Analysis
XRP long-term Price Analysis: 3 November

While Bitcoin witnessed a minor pullback on the 24-hour window, altcoins collectively witnessed strong corrections. XRP was set back by almost 4%, consolidating right above its immediate resistance. With the market exhibiting extreme turbulence, for XRP’s long-term, the price might find it difficult to rise up in the charts, but not impossible.
XRP 12-hour chart

Source: XRP/USD on Trading View
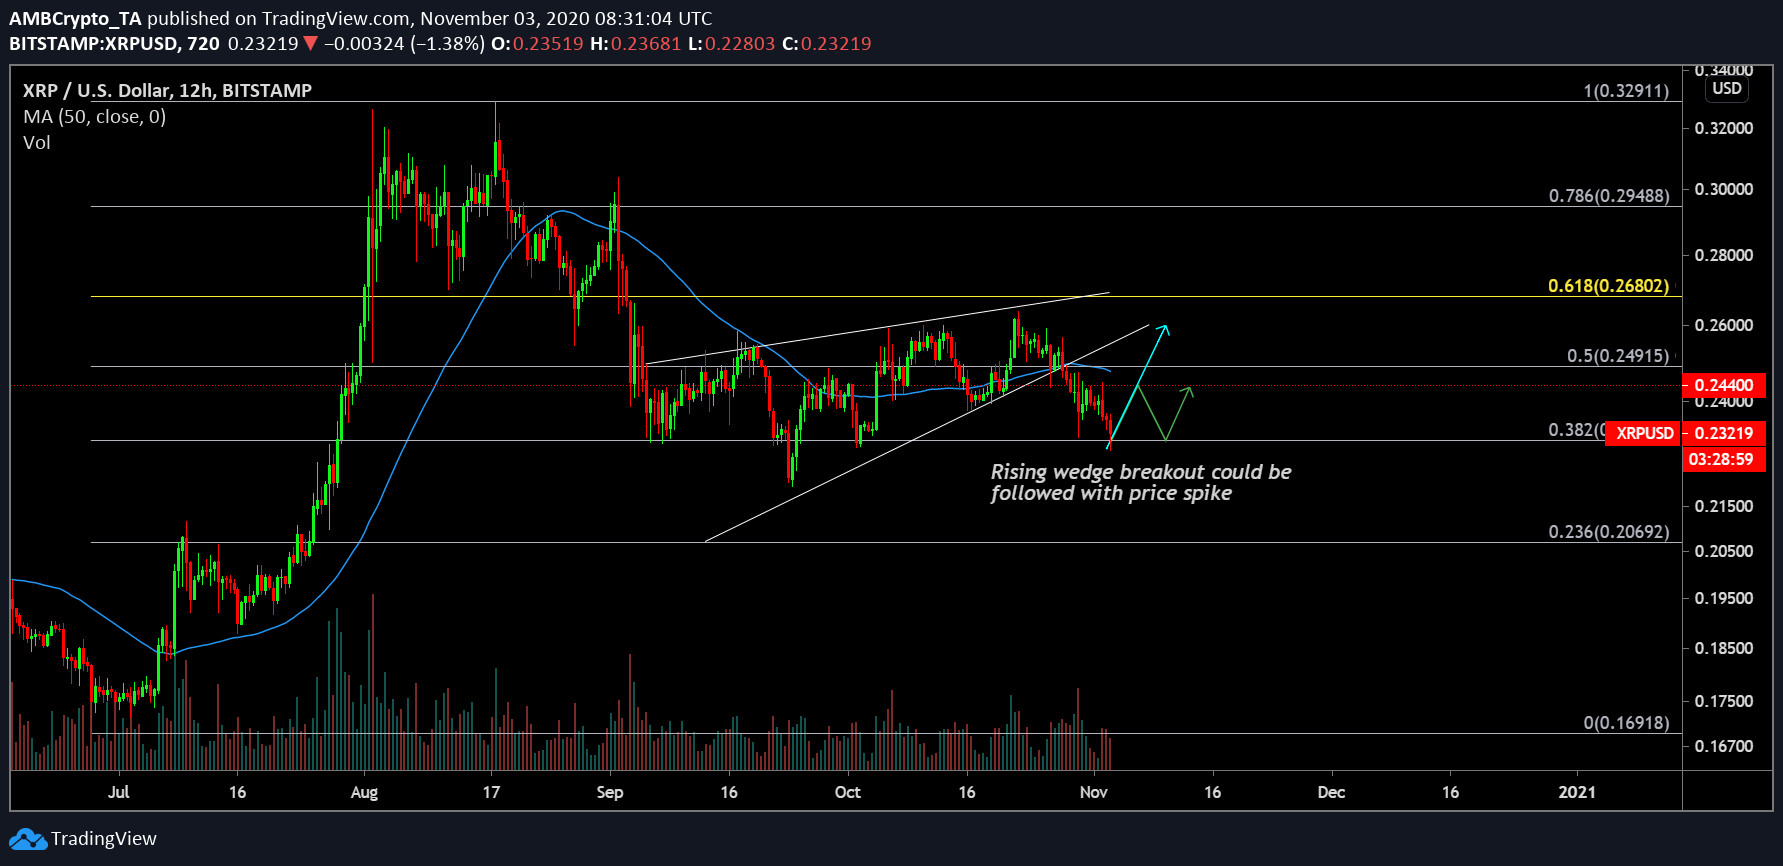
According to the 12-hour chart of XRP, the 24-hour pullback did not matter at the moment since the token has been facing a steady decline since 22nd October. While the asset oscillated within the trend lines of a rising wedge, the eventual bearish breakout happened on 28th October. Since then, the price has continued to drop, reaching its 0.382 Fibonacci retracement line(i.e $0.2305). Now the price may attain a quick bounce back since it re-tested its major support but there might be strong resistance at $0.249.
The trading volume of XRP is considered regardless of the volatility. While the blue path is a possible direction forward, more sideways movement between $0.2300 and $0.249 can be expected.
Source: Trading View
Reasoning
Drawing out a clear trend at the moment is a little difficult, as the market indicators were not exactly predominantly bullish or bearish. MACD suggested a clear bearish trend as the MACD line lagged behind the blue line, Awesome Oscillator failed to indicate a clear rise in bearish momentum.
On the other hand, Stochastic RSI indicated another bearish takeover in the over-sold region which should likely improve the chances for a bullish rally in a week. However, the trend is still inclining more towards a bearish realm.
Conclusion
Source: Trading View
The weekly chart has been added to attained more clarity on the conclusion as the weekly chart is clearly bearish at the moment. The Relative Strength Index or RSI dropped below the 50 mark for the first time since July. Hence, a strong bearish period is likely possible going forward in the long-term.

