Analysis
XRP, Dogecoin, Chainlink price analysis: 26 August

The cryptocurrency market witnessed a slow week. The values of major crypto assets were witnessing corrections. However, on one hand, where major assets were reporting only 9% gains in August, small-cap assets were up by more than 50%.
XRP

Source: XRP/USD on TradingView
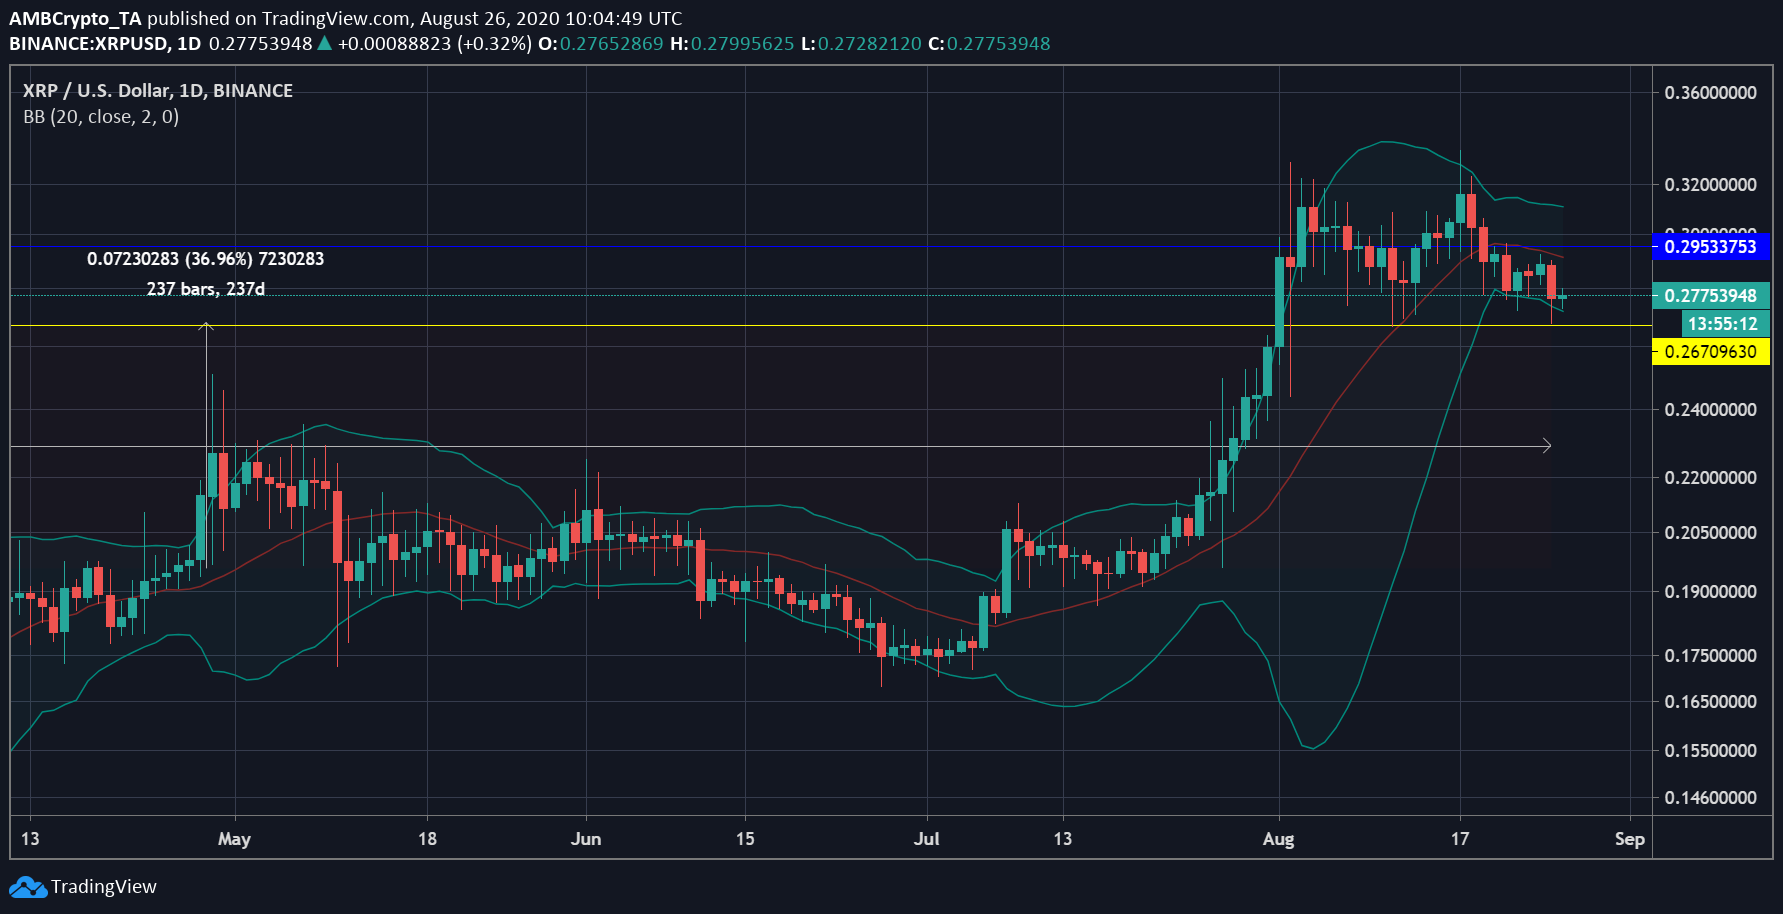
The XRP market had been deprived of volatility since the second-half of 2019, and finally saw its price peak at $0.3417 in February 2020. However, this was way lower than the top price witnessed in 2019, which was $0.5550. The value of the asset was once again restricted at $0.2777. The price has been moving sideways over the past few days, while the market was expecting more volatility.
As per the divergence of Bollinger Bands, XRP may be hit by volatility, which could cause the price of the digital asset to briefly dip. This bearishness was indicated by the moving average, which remained above the price bars, indicating a reversal of the earlier trend. As the value of the asset remained closed to its immediate support at $0.2670, the value of XRP could bounce back from this point. However, resistance too remained close at $0.2953.
Dogecoin [DOGE]
Source: DOGE/USD on TradingView
Dogecoin AKA meme coin has been witnessing low momentum in its market. The coin pumped due to a pump planned via TikTok videos. The value of the asset spiked 151% within two days, but also crashed almost immediately. Despite a low momentum, DOGE was being traded at $0.0032. The price of DOGE has been bouncing between immediate resistance and support since mid-July and has not managed to break away.
According to the Awesome Oscillator indicator, DOGE was experiencing low bearish pressure in the market, at press time. The movement below the zero mark was indicative of bearish pressure in the market.
Chainlink [LINK]
Source: LINK/USD on TradingView
Chainlink [LINK] was valued at $14.66. Ever since hitting its peak at $17 on 17 August, the coin has been trending downward. Its price has tested immediate resistance at $13.05 twice, while resistance at $16.13 remained strong.
Parabolic SAR indicator reported this reversal in price trends, as markers aligned above the candlesticks. This was considered a bearish sign, as the market expected the price to shrink further.
