Analysis
XRP, Chainlink, Binance Coin Price Analysis: 24 August

After a couple of days of bearish pullback, the collective crypto industry breathed a sigh of relief as major altcoins registered a minor uptick to keep pace with its overall bullish trend. Although bearish signals were still evident in the markets, the past 24-hours have highlighted a sea of green signals all across the board.
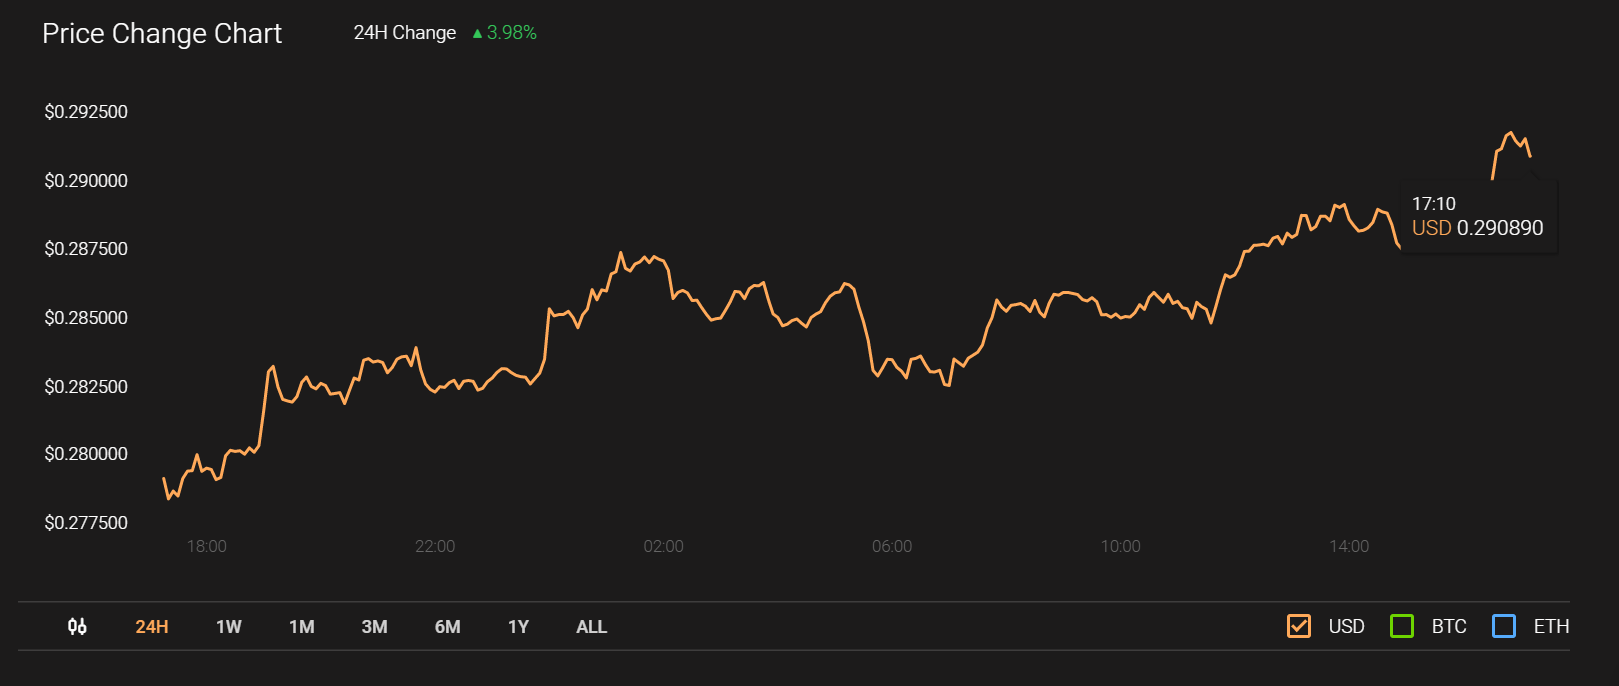
XRP 1-hour chart

Source: Coinstats
XRP’s recovery towards $0.30 came right after the asset recently tested its support at $0.274. The asset’s market cap surpassed the $13 billion mark once again as XRP registered a trading volume of $1.25 billion in the charts.

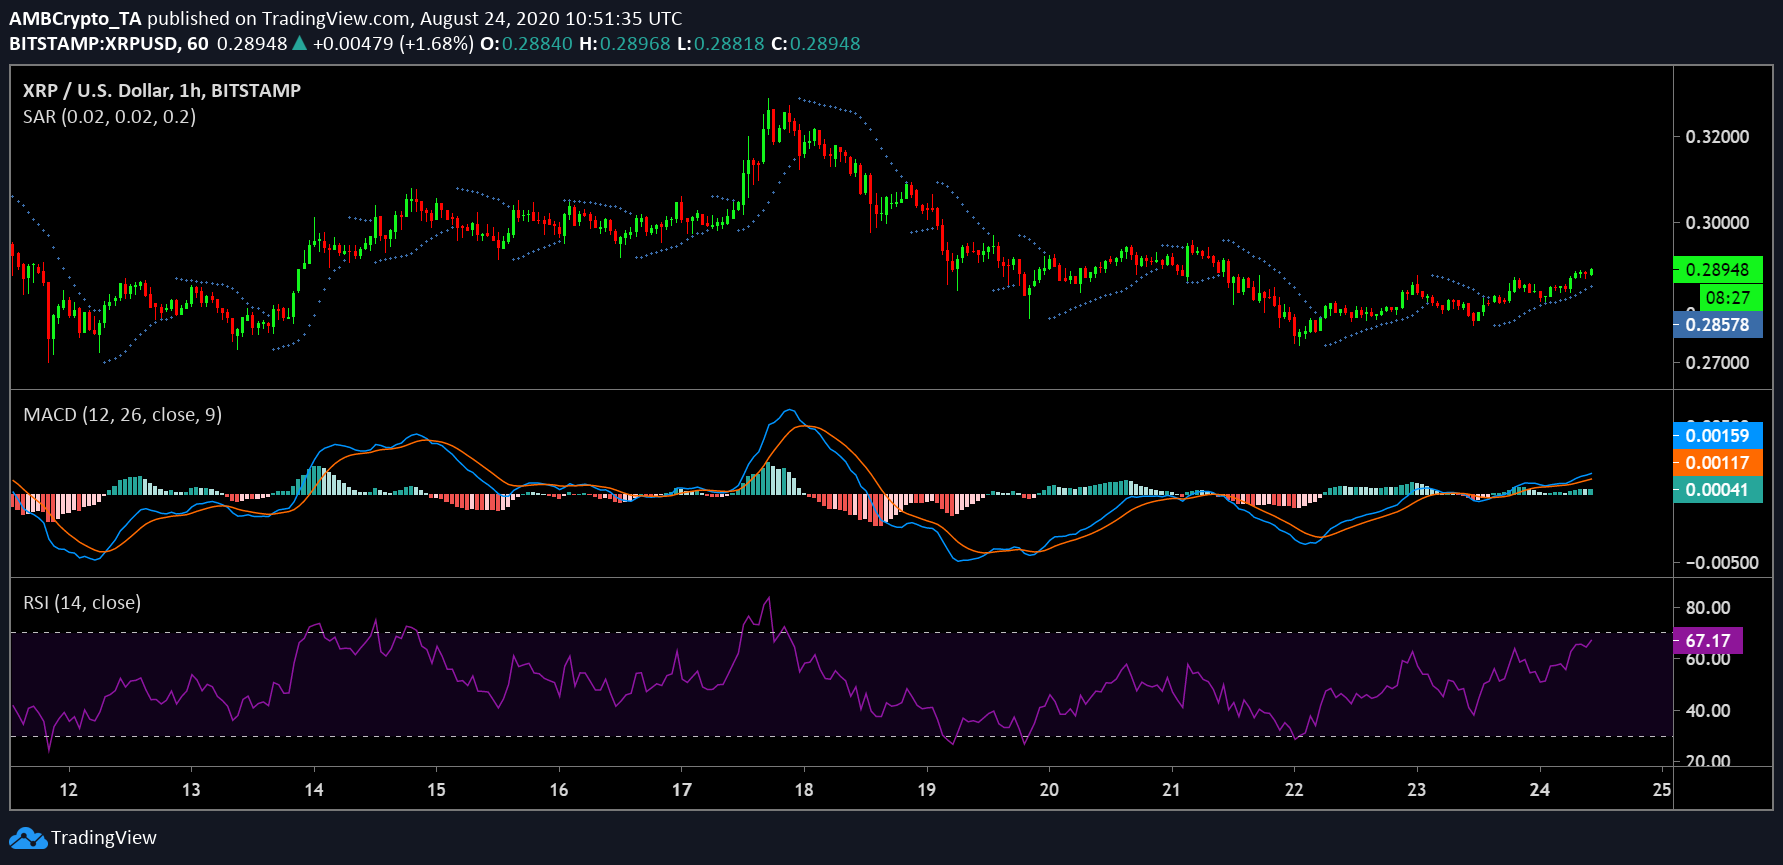
XRP/USD on Trading View
XRP’s MACD suggested a bullish trend as the blue line hovered over the red line. Parabolic SAR indicated a continued incline as well. Relative Strength Index registered a higher buying pressure; however, a reversal will lead to another period of corrections.
Chainlink 1-hour chart
LINK/USD on Trading View
Chainlink’s witnessed one of the strongest recoveries over the past few days, retracing all the way down to $12.94 before climbing towards $16 in 24 hours. LINK was valued at $15.58 at press time with a market capitalization of $5.485 billion.
Chainlink’s ecosystem also registered an all-time high in terms of daily active addresses in the charts. The positive fundamental improvement was mirrored by Chaikin Money Flow, which suggested an increase in capital in-flow as MACD continued to remain bullish for the coin. Parabolic SAR attained support for LINK’s price as the dotted line was observed under the candlesticks.
Binance Coin 1-hour chart
BNB/USD on Trading View
With a building bullish momentum indicated by Awesome Oscillator, Binance Coin completed a 5.15 percent hike over the past day. For BNB, one key observation was a lack of significant trading volume, as its market cap of $3.29 billion was coupled with low volumes of $190 million.
Bollinger Bands opened the doors for further volatility in the charts as the bands appeared to diverged. Klinger Oscillator suggested that capital was driving the rally.

