With Bitcoin slowly severing its connection with the stock markets and trying to breach the $7,000-mark, the community seems to be in a good mood. Fear seems to be retaliating with the FGI at 12, a 2-point improvement from the last week.
Longing Bitcoin here in hopes of a quick rally would be devastating due to, not one but multiple reasons. Hence, this article concerns short-term investors and not the ones who plan to hold Bitcoin over the years to come.
The sentiment here would be that $7,000 is a psychological level, like $6,000 was, and breaching it would provide good returns. Adding to this overtly bullish narrative is the approaching Bitcoin halving which is less than 39 days away, whose narrative is that “price tends to rise before the event”.
Nik Patel mentioned in his tweet that 3 prominent retail brokers in the UK were largely long. From the tweet, each brokerage had at least 75% of the traders’ aligned long.
Reasons to not long BTC here
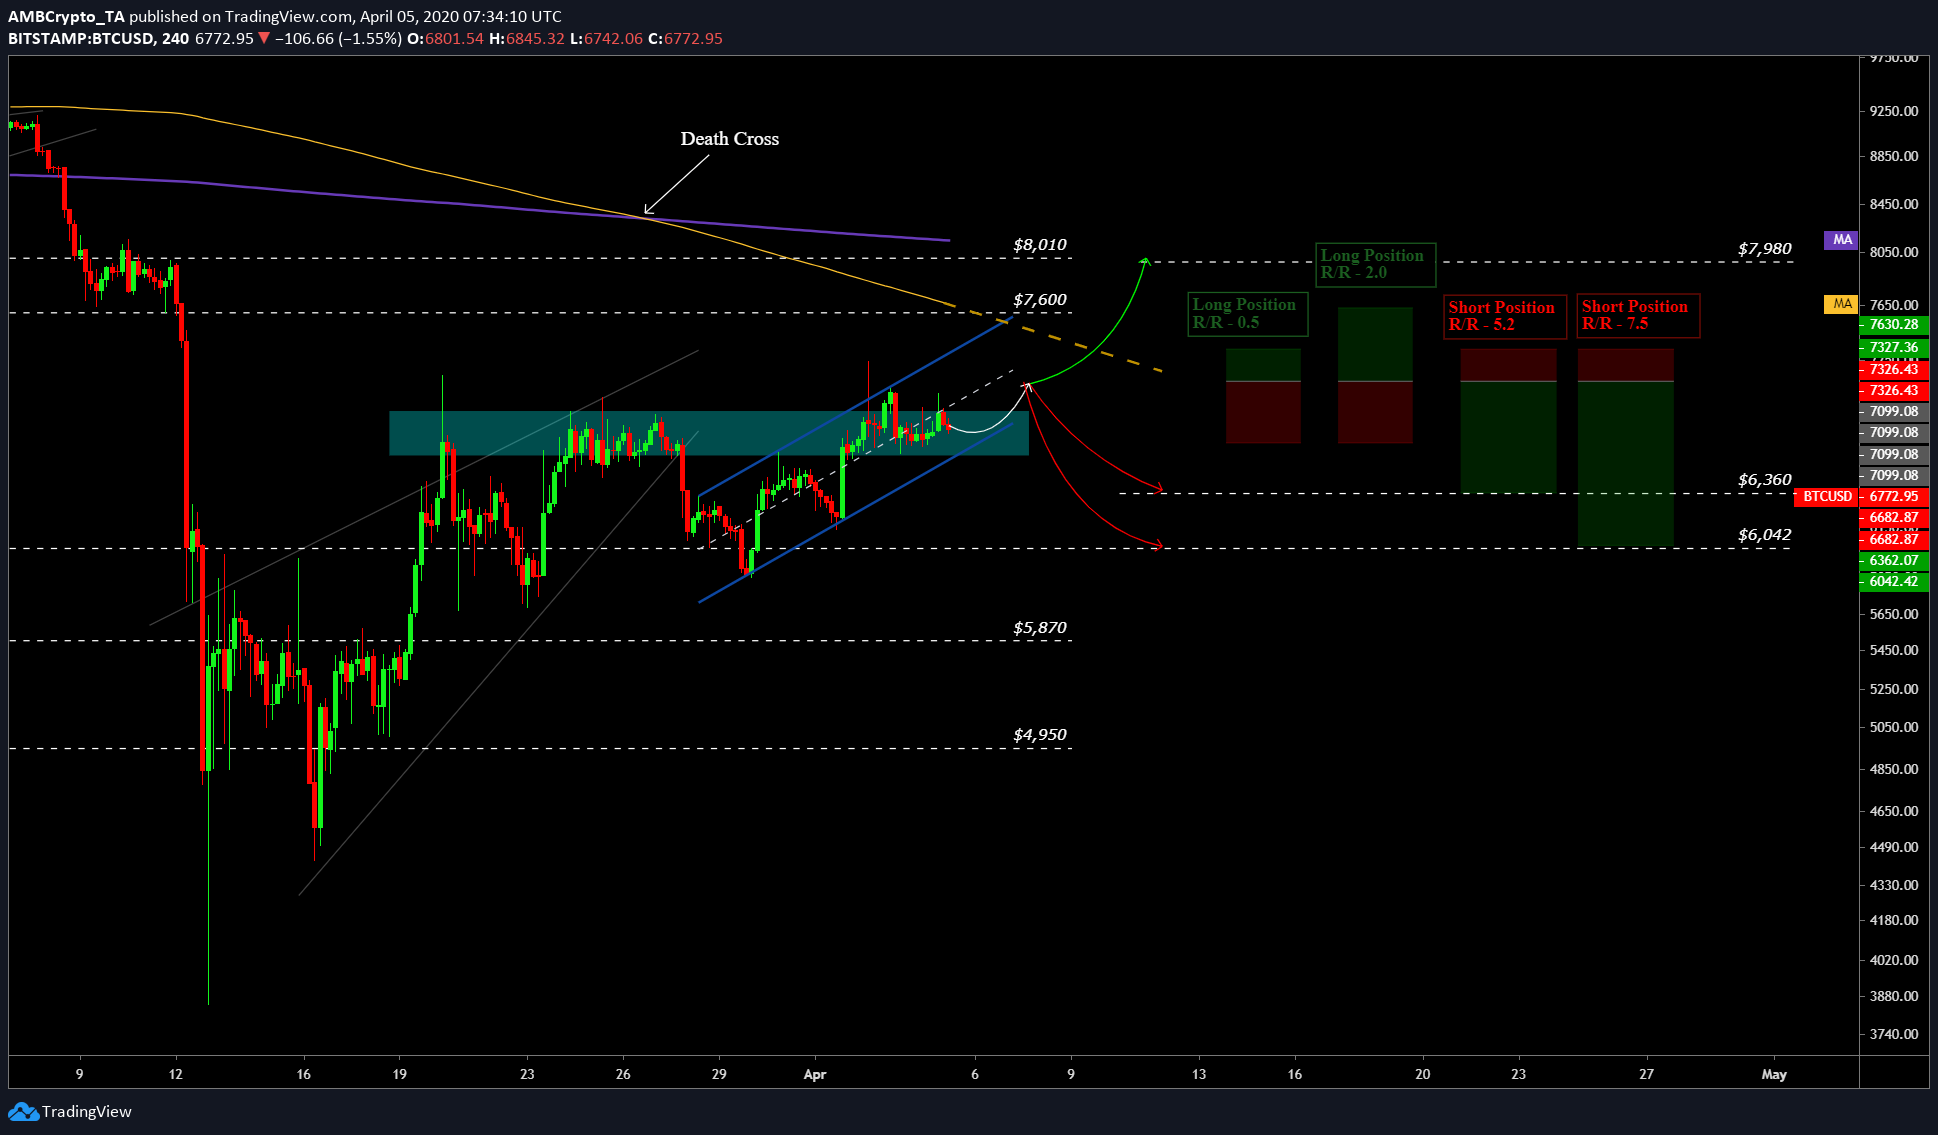
Source: BTCUSD TradingView
Reason 1
From left to right, the chart attached showed the formation of a parallel channel sloping upwards, indicating that the prices were rising. However, a breakout from this pattern is bearish, most of the time, which is the first reason not to short here.
Reason 2
For BTC to move higher, it has to pass through a thick zone of resistance that ranges from $6,600 to $6,900 or $7,000 [approximately]. Although the price has managed to breach this zone, the bears have kept the bulls in check, hence the sharp wicks in this zone. Further, this zone has been tested thrice so far, and the 4th and the most recent test seemed to be failing [at the time of writing]. Another failure from this zone would likely exhaust buyers and send the price crashing violently, however, if breached, the opposite of the statement also holds true.
Approaching closer to the price every passing day is the 50-day moving average [dashed yellow line]. A few days more, perhaps, weeks, and the price will eventually meet with this level, which will resist the buyers, making this the third reason to not long BTC. Additionally, a sharp rise from the aforementioned resistance zone would take the price quicker to the 50DMA.
Reason 3
Perhaps, the most important reason to not long BTC here would be the state of the world economy, which is on the brink of collapse. “Brink”, because the COVID stimulus package will eventually be worth nothing since the economies are halted, there is no production.
Oaktree Capital’s Howard Marks said it best,
“The longer people remain at home, the more difficult it will be to bring the economy back to life. But the sooner they return to work and other activities, the harder it will be to get the disease under control.”
Due to the recently developed correlation with the stock markets, there is a risk that a drop like March 13, might occur again, no matter how small.
If longing Bitcoin would be a risky move, then staying neutral would pose no risk, at least in the long term. Even if one were to long at $7,085, the position would be stopped at the above-mentioned confluence of resistance[$7,325]. However, shorting Bitcoin here would be profitable and could be done with limited risk exposure. In case, Bitcoin manages to breach this resistance at $7,325, the Risk-Reward Ratio [R/R] would be 2.0, considering closing the position at $7,650.
Why short BTC?
Referring to the right side of the chart attached, shorting at $7,085 or $7,090 would be the best play. Also, shorting BTC here has two possibilities, one with an R/R of 5.2 and the other with 7.5.
Both the positions would be exposed to a risk of 3.20% while providing a reward of 10.38% [R/R 5.2] and 14.8% [R/R 7.5]. The first position would push Bitcoin to $6,360 whereas the second would push BTC down to $6,042.
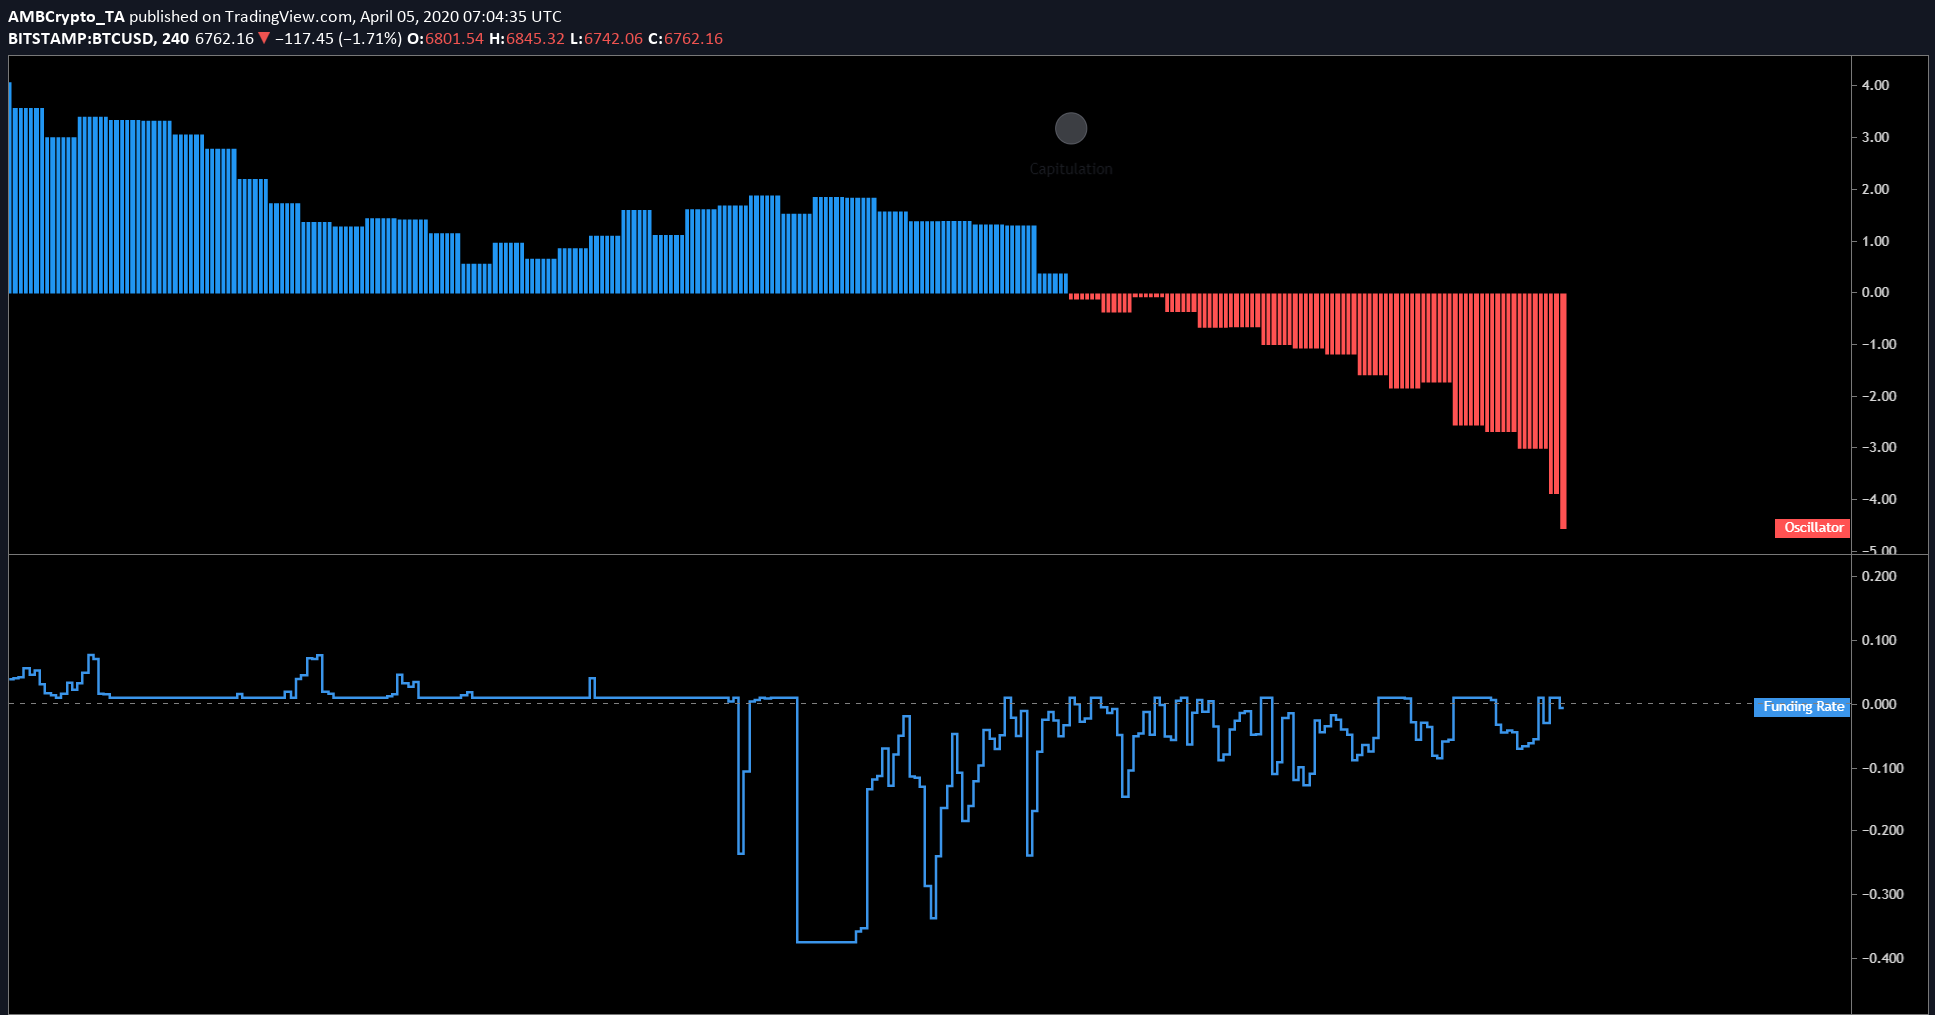
Source: BTCUSD TradingView
Supporting the short scenario is the Bitcoin miners, who are under massive pressure, especially after March 13’s collapse. This can be seen in the Hash Ribbons indicator developed by Charles N. Edwards, which is flashing red [indicating capitulation]. Additionally, the funding rate, as seen on BitMEX, has largely been on the negative side, indicating the bearish pressure.
Summary
From March 05 to April 15, the price of Bitcoin will alternate between a local high of $8,010 and a low of $6,040 and this is assuming Bitcoin’s usual volatility. As seen in the chart, these are the levels to keep an eye out for – $8,010, $7,600, $7,300, $7,000, $6,360, $6,040.
Shorting at the mentioned levels would provide maximum profits with the least risk, however, longing BTC here would be a bad idea.
To quote a cliché, “expect the unexpected”, especially with Bitcoin would be apt; nobody expected Bitcoin to surge as much as it did during April 02, 2019, especially when the price of Bitcoin had just resurfaced to $4,000 after dipping down to $3,000 earlier that year. While we are in the month of April, the same thing could happen.