Why Solana is likely to trade between $50 – $60 in December

Disclaimer: The information presented does not constitute financial, investment, trading, or other types of advice and is solely the writer’s opinion.
- Solana was set to break past the $60 resistance that was set nearly eighteen months ago.
- A range formation between $50-$60 was possible over the next month or longer as prices seek liquidity without a true breakout.
Solana [SOL] has a strong bullish outlook on the price chart. News of the USD Coin [USDC] monthly transfer volume of over $70 billion only reinforced the positive sentiment behind the blockchain platform.
After trading within a range from $10-$26 for nearly a year, Solana broke out and has already achieved extraordinary gains for a large-cap asset.
From 20th October to 16th November, SOL managed to gain 148% from $27.5 to the peak at $68.2. However, this run could be halted for the next month or two.
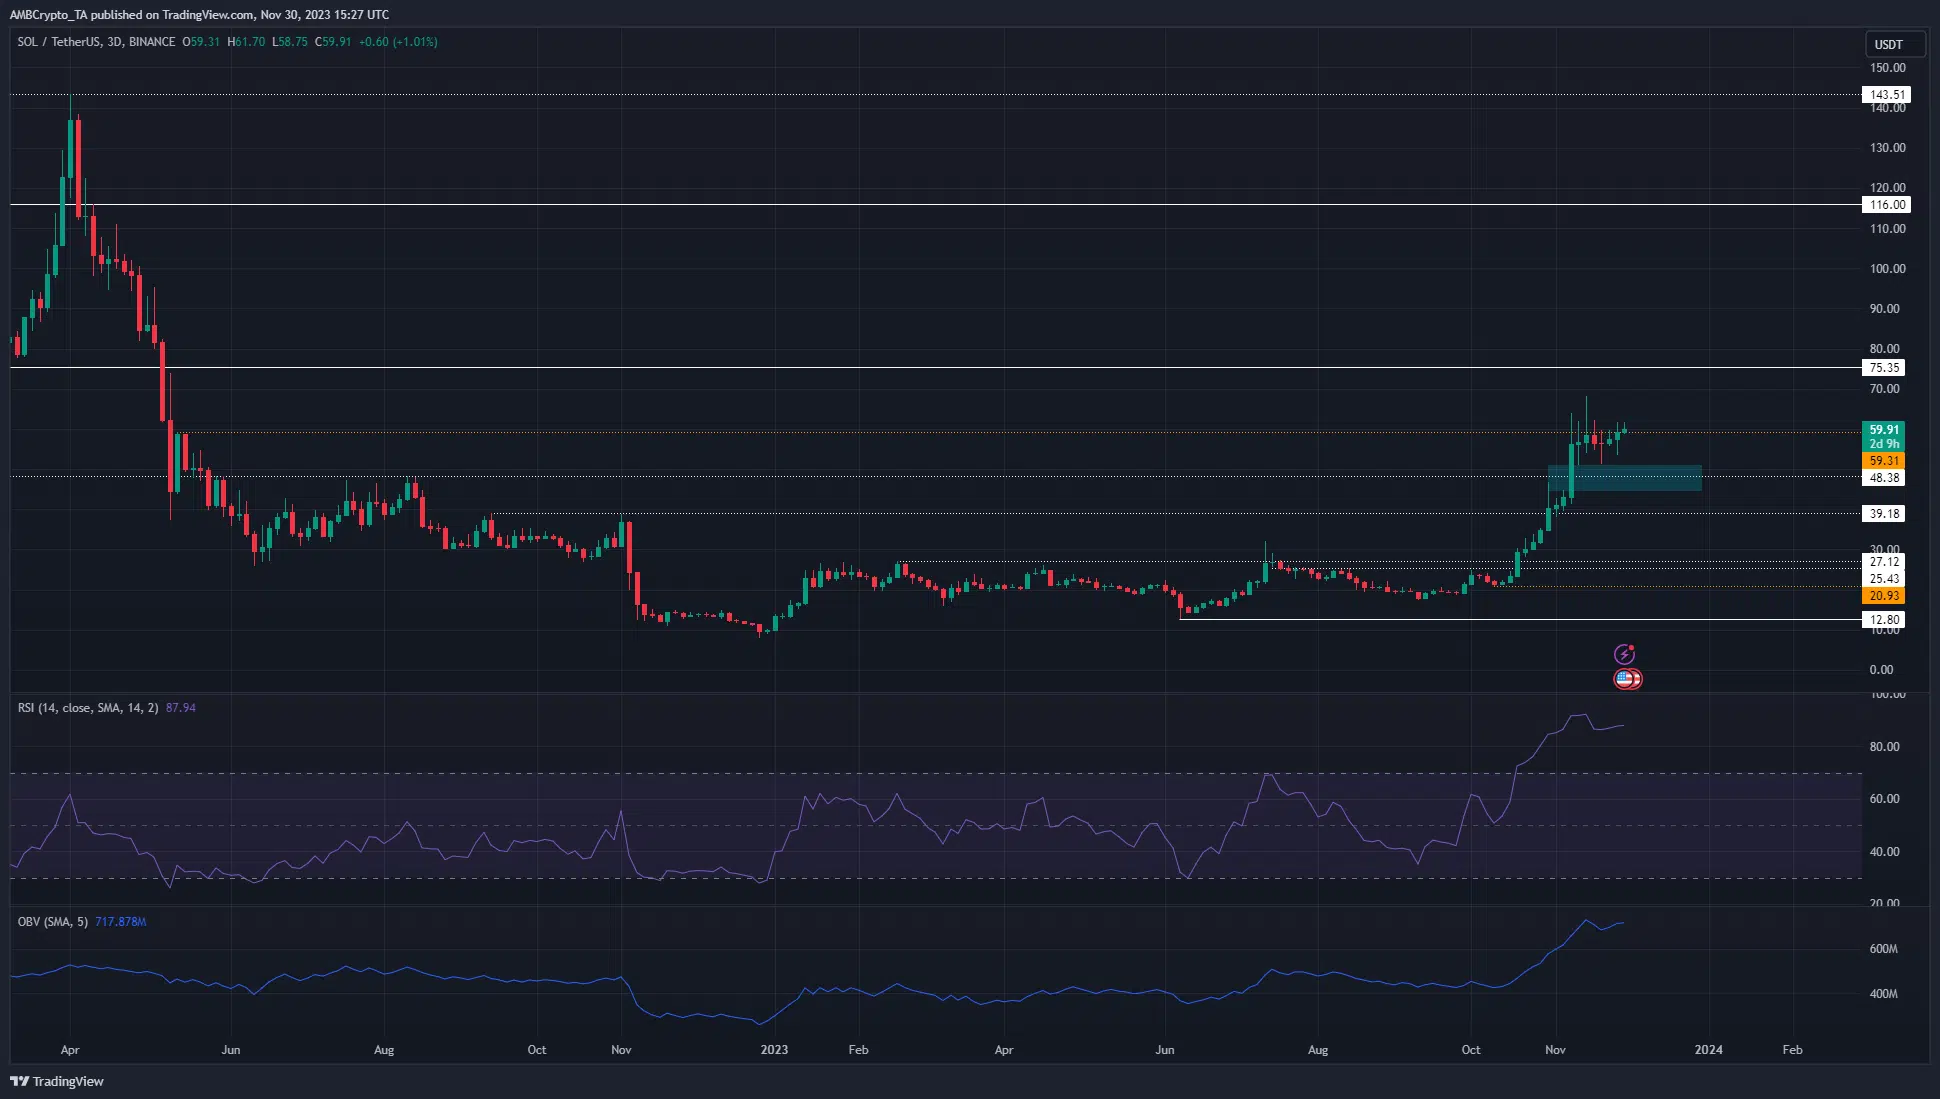
Solana was trading at the high from May 2022
The three-day chart above showed that the market structure was strongly bullish, as was the momentum. The RSI was at 87 but no significant pullback was in sight yet. The On-Balance Volume also continued to advance higher.
This showed buying volume remained high and that further gains could be expected. Yet, there was a significant pocket of liquidity to the south at $50. Not every liquidity pocket needs to be revisited, as Solana has shown over the past six weeks.
However, there was reason to suspect that the market could pivot once more in the $62-$68 region. Traders need to be prepared for a breakout as well as a rejection.
Despite the extremely bullish outlook, liquidity could pull the SOL market southward

Source: Hyblock
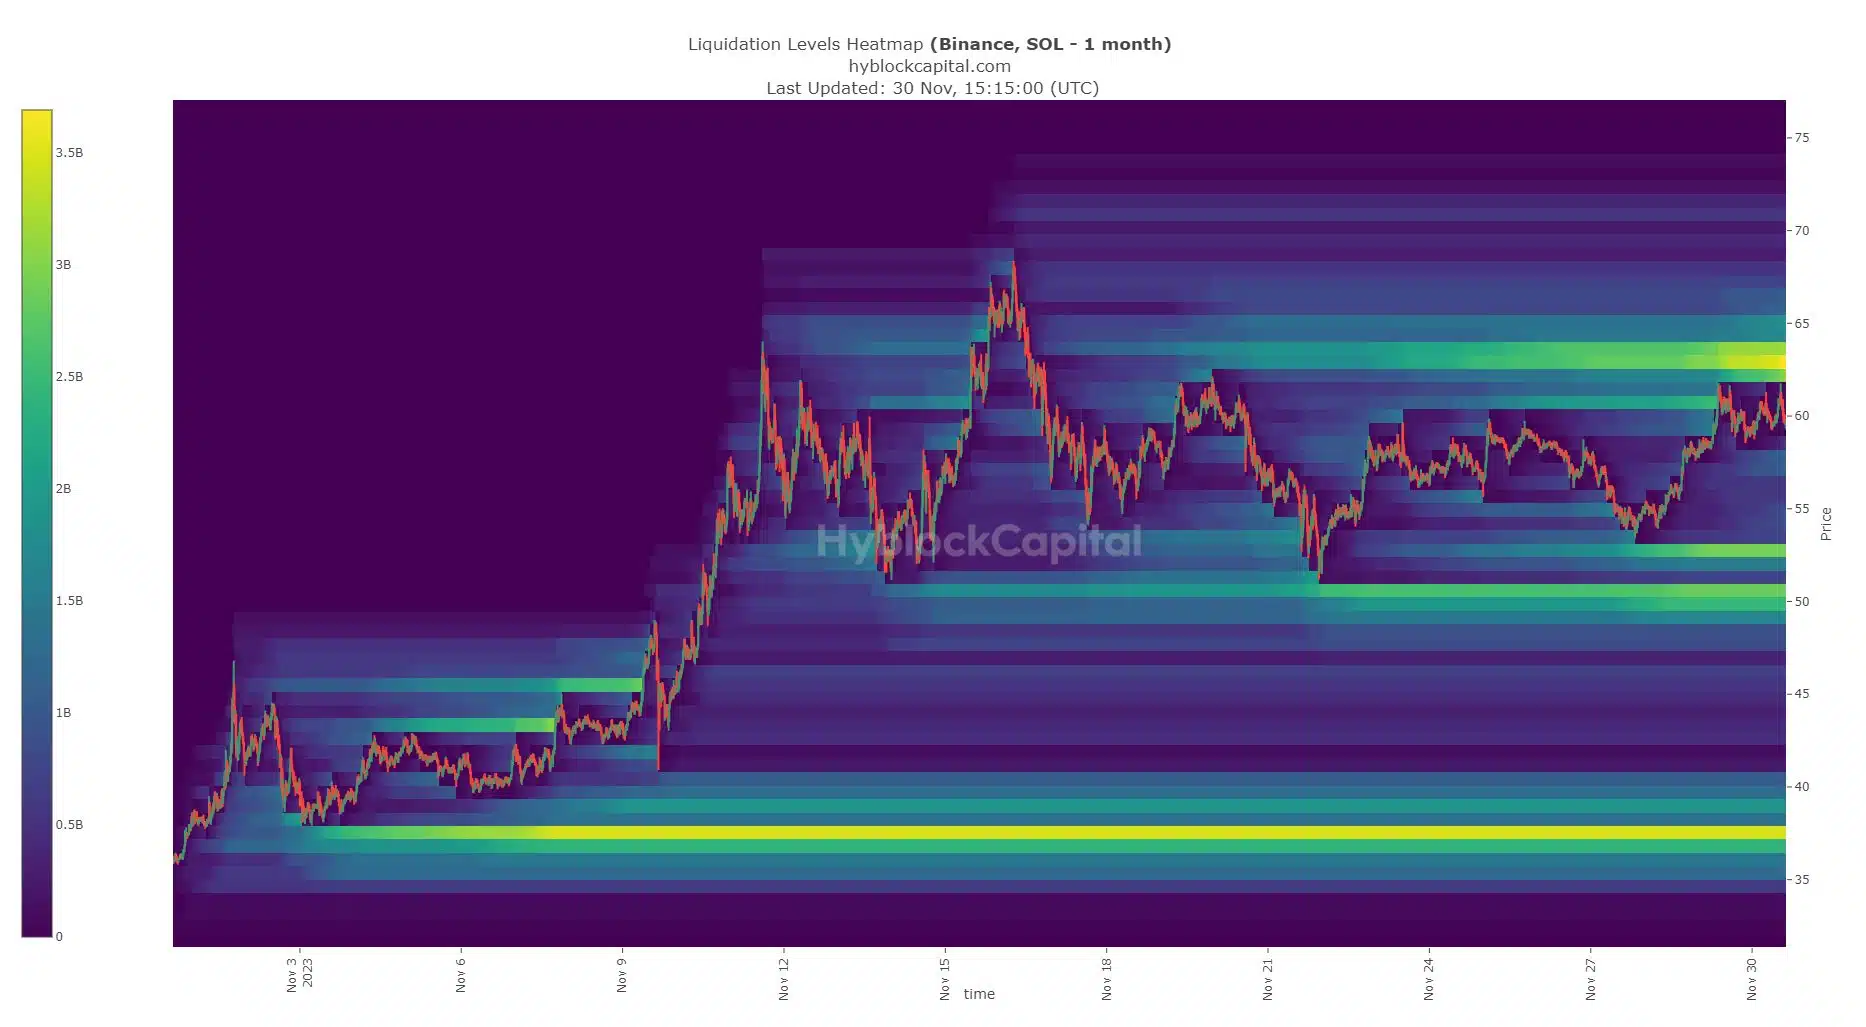
AMBCrypto analyzed the liquidation levels heatmap from Hyblock. The past month’s data showed that a move to the $62.5 region could trigger a huge number of liquidations.
The forced market buys from short liquidations could potentially see SOL pushed higher toward $70 before a reversal.
Read Solana’s [SOL] Price Prediction 2023-24
To the south, an ample number of liquidations sat at $50 and $52.75.
Therefore, if SOL is unable to climb above $68 and flip the $60-$65 zone to support on the one-day or 3-day chart, a retracement toward $50-$52 would be likely.


