- New transactions on Shibarium have rallied to a monthly high.
- This happened amid a persistent decline in BONE’s value.
New demand for Shiba Inu’s [SHIB] Layer 2 (L2) network Shibarium has climbed to its highest in the last month, as the protocol recorded a daily high of 44,000 transactions on 23rd November, according to data from Shibariumscan.
The daily tally of addresses engaging in transactions for the first time on Shibarium began an upward trend on 20th November and has since surged by more than 390%.
Source: Shibariumscan
The rise in demand for the L2 network is also reflected in its transaction volume, which continues to rally daily. As of 21st November, the transaction count reached 35,000. This was the highest daily peak for Shibarium since the 62,000 transactions recorded on 25th October.
A BONE to pick?
The recent uptick in Shibarium demand over the past few days could be attributed to the consistent decrease in the value of BONE, the token used for paying transaction fees on the protocol.
AMBCrypto found that the average transaction fee plummeted to a low 0f 0 BONE on 21st November as the token’s value continued to decimate.
According to data from Shibariumscan, the last time Shibarium saw its average transaction fee at such a low level was on 16th October.
Source: Shibariumscan
As of this writing, the average fee to complete transactions on the L2 network was 0.01 BONE, worth around $0.0006.
BONE traded at $0.6155 at press time, shedding 21% of its value in the last month, according to data from CoinMarketCap.
While the rest of the market witnessed a significant uptick in demand in October, which pushed their key momentum indicators to new highs, BONE’s low trading activity during the period kept its Relative Strength Index (RSI) and Money Flow Index (MFI) below their respective center lines.
Still trending downward at press time, BONE’s RSI and MFI were 37.55 and 38.45, respectively. These values showed that selling activity continued to gain momentum in the meme coin’s spot market.
Read Shiba Inu’s [SHIB] Price Prediction 2023-24
Further, BONE’s Directional Movement Index (DMI) setup confirmed that bears had control of the daily market.
The negative directional index (red) at 21.94 was above the positive (green) index at 13.32. This suggested that the ongoing downward price movement was stronger than the possibility of any uptrend in the short term.
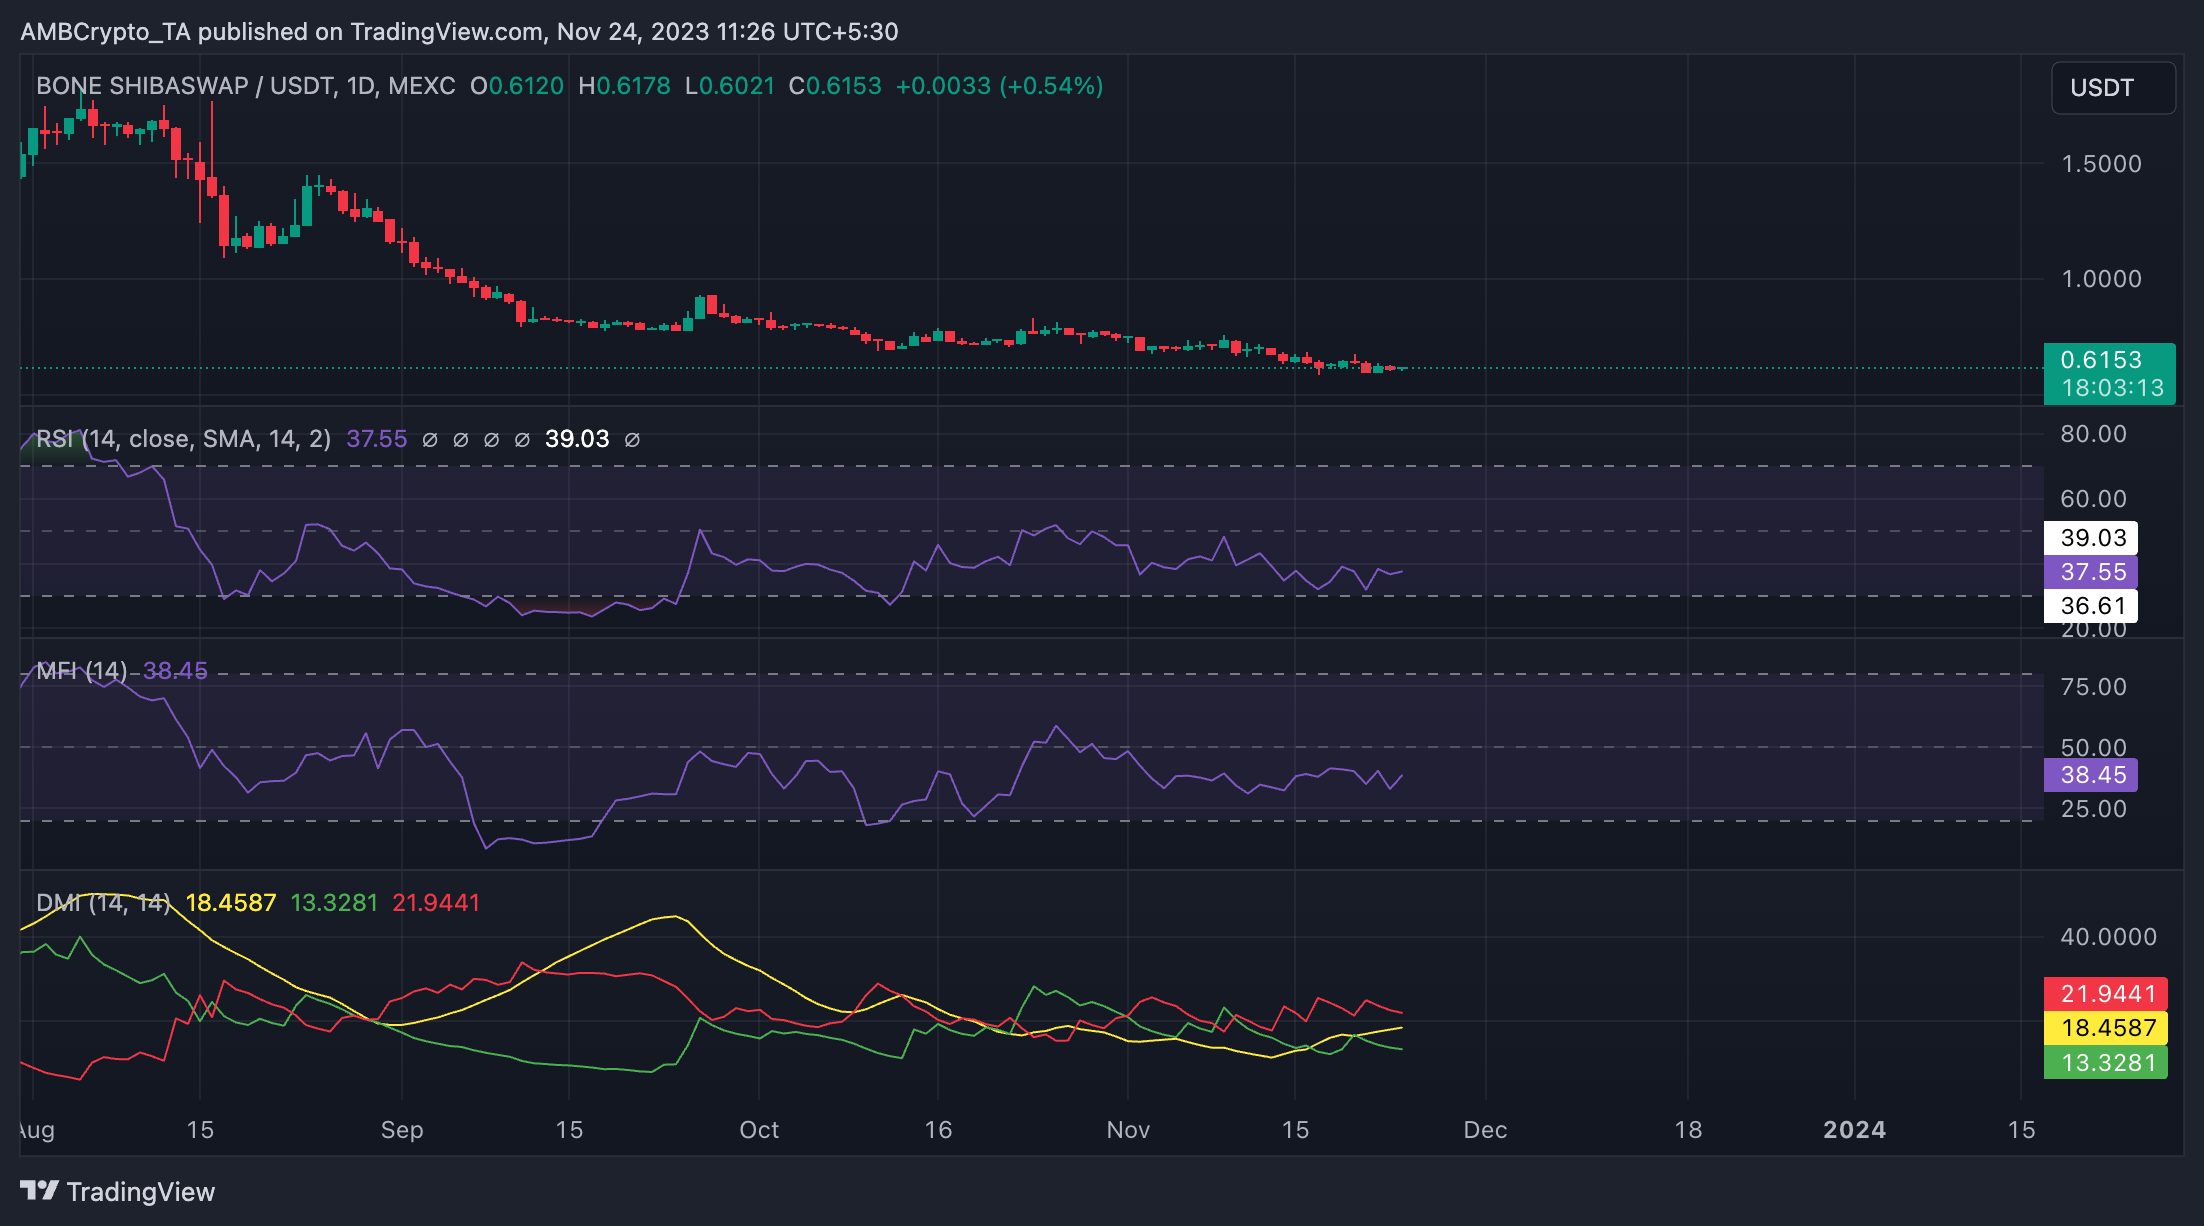
Source: BONE/USDT on TradingView