What Bitcoin’s Fear and Greed Index says about BTC’s next rally

- Fear and greed index, when hitting extreme levels, have historically triggered corrections.
- Bitcoin’s resilience despite these signals hints at a shift in sentiment.
Just a week into the new year, Bitcoin [BTC] has already entered the greed phase. After a massive 121% return in 2024, there’s no doubt investors are eyeing an even bigger cycle ahead.
But hold on – let’s not get ahead of ourselves. The crypto market is no stranger to volatility, and the ‘risk’ of investing in crypto still looms large.
So, as we head into a new week, what do the on-chain data say? Will BTC continue its upward momentum, or are we in for a pullback?
Bitcoin fear and greed index shows an unusual anomaly
In 2024, Bitcoin’s fear and greed index reached extreme levels twice, each time marking a peak followed by a sharp correction.
The first instance occurred when BTC hit $73,000 in March, its previous all-time high. Extreme greed took over, with investors chasing massive returns. However, a slight market shift triggered panic selling, causing BTC to drop to $65,000 in less than a week.
Fast-forward to Q4 and something surprising happened on the 22nd of November.
For two weeks, the fear and greed index flashed “green” as Bitcoin approached six figures, but the market didn’t hit a ceiling. Instead, BTC defied expectations and surged to a new all-time high of $108,000.
What happened? Despite on-chain data—such as a peaking RSI, bearish MACD, and an overheated greed index—indicating a potential market correction, Bitcoin continued to climb.
AMBCrypto investigated and found a key reason for this anomaly: BTC ETFs and corporate holdings. For fourteen straight days, ETFs experienced constant inflows, while MicroStrategy (MSTR) made its largest purchase yet, acquiring 55,000 BTC.
This could mark a turning point. Why? Next time the fear and greed index spikes and the market overheats, a similar buying frenzy from ETFs and institutions could prevent a correction. Instead, it could set BTC up for its next breakthrough.
But, what’s Bitcoin’s next target?
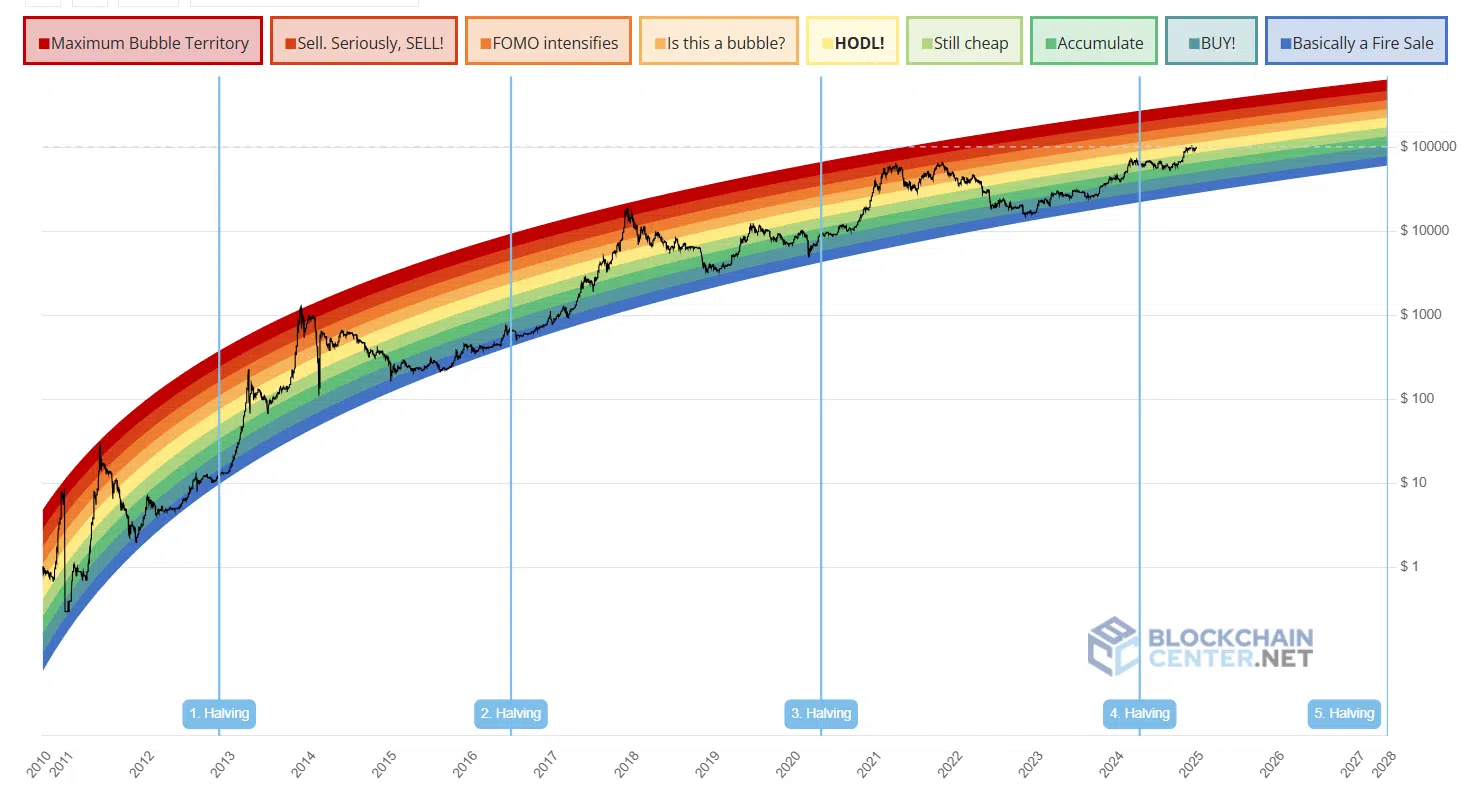
Bitcoin has officially broken out of the “still cheap” zone on the Rainbow Chart, reflecting its impressive rise to $101K.
Long-term holders who started accumulating at $60K are reaping the rewards, sitting on significant unrealized profits. The market’s focus is shifting toward HODLing.
But here’s where it gets interesting: this phase is make or break for Bitcoin. Historically, the path ahead from here could either be explosive or a sharp pullback.
Remember back in March? Bitcoin entered a similar HODL phase, only to experience a ‘crash’ when HODLers prioritized short-term gains.
Read Bitcoin’s [BTC] Price Prediction 2025-26
However, with the market landscape shifting – thanks to massive corporate buys and a steady rise in BTC ETFs – the outlook has completely changed.
The fear and greed index is showing more stability than before, making it likely that this time, HODLing will win out. All signs are pointing to a potential new all-time high for Bitcoin this week.


