Waves, Augur and Ethereum price: Bearish channel persists as optimism hovers

With the collective cryptocurrency market trading sideways, altcoins are moving helter-skelter. Ethereum, Waves and Augur, three diverse altcoins have moved in different directions, one is is yet to recover, another is trending upwards, while the third is trading flat.
Ethereum

Source: ETH/USD via Trading View
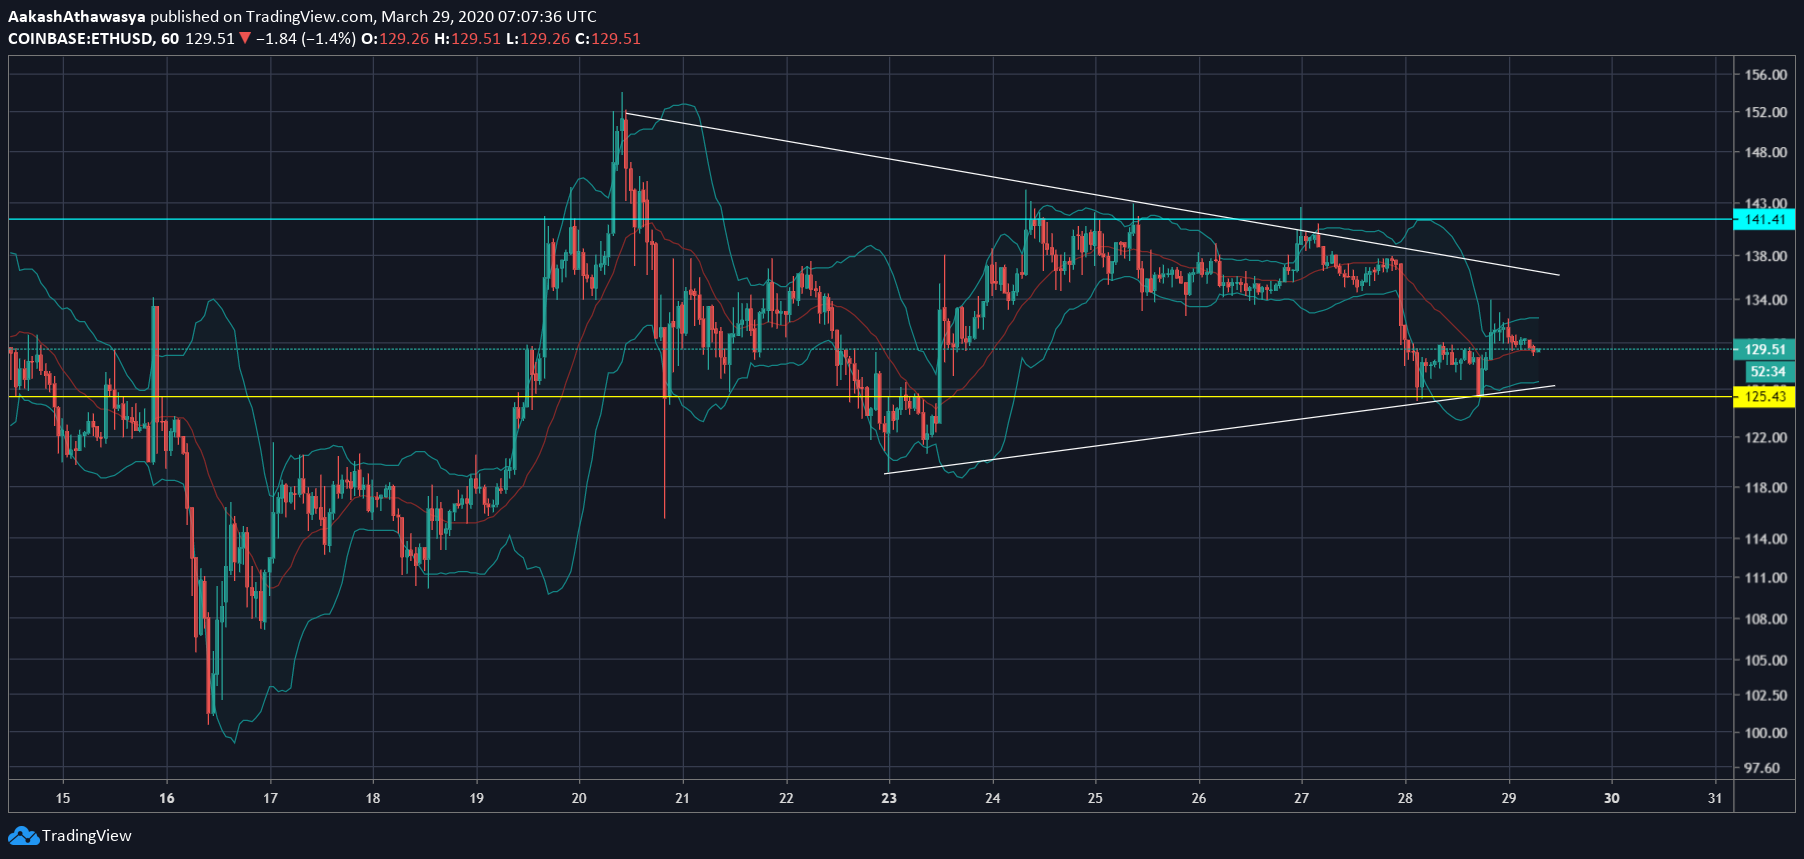
The leading altcoin in the market saw increasing decoupling from Bitcoin earlier in the year, but now the push-and-pull with the leading cryptocurrency is back. Ether, posting a market cap of $14 .1 billion, is trading with a narrow increasingly downward sloping wedge, formed as a consequence of the infamous March 12 drop, when Bitcoin lost almost half its value.
Resistance, for the altcoin, lies quite high at $141, while the press time price was $129. Looking down, the altcoin finds support, closer to its market price at $125.4, which is where the lower bottom of the wedge lies.
Bollinger Bands for Ethereum posit an increase in volatility as the bands are moving further apart. Given that in the last two hours the candlesticks have turned red, the average is now intersecting with the price, if it moves above the price, bearish woes lie ahead.
Augur

Source: REP/USD via Trading View
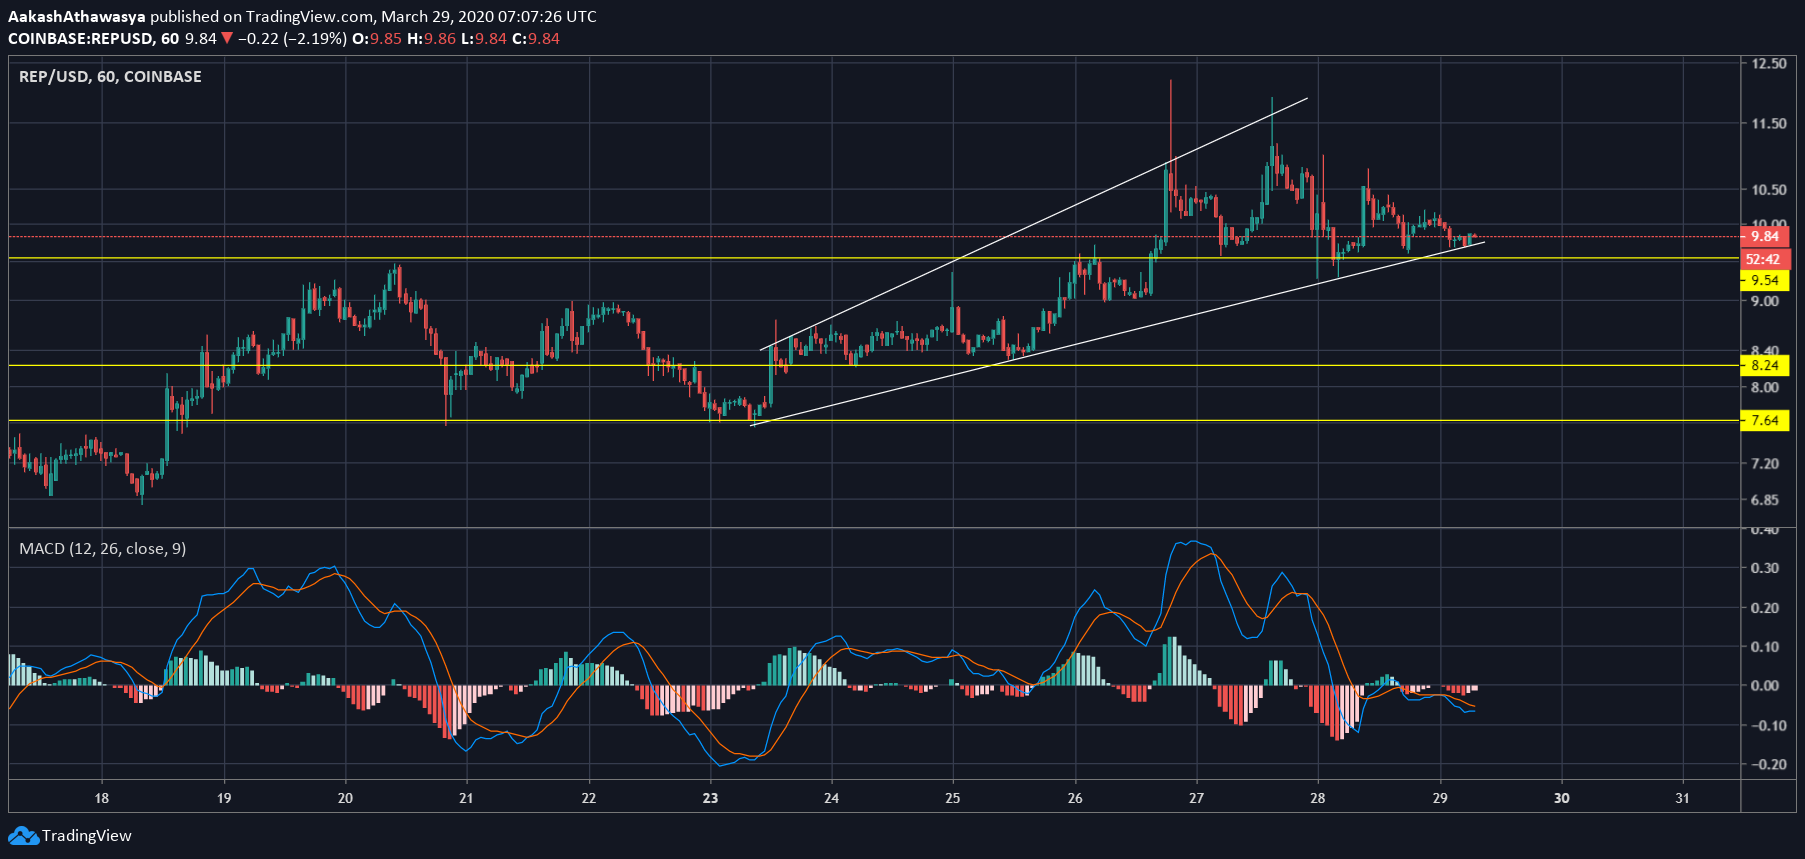
Augur, unlike its contemporaries, is trading in an upwards channel, with the price rising since the beginning of the previous week. Owing to the March 12 collapse, Augur had lost almost a third of its value, falling to a low of $7.86. Since then, the upwards channel has pushed the coin as high as $9.86, its press time price.
Since hitting the support of $7.64, the altcoin has seen bullish pulls, allowing it to break resistance after resistance, flipping it into support levels. Two such levels can be charted at $8.24 and $9.54, respectively. Despite the fall on 27 March, REP has managed to steer clear of the drop below the latter support, and now is striving to trade within the upward channel.
MACD line for REP has moved below 0 and has dipped below the Signal line indicating bearish pressures. With the upward channel’s lower-bound trend line close to the price, the coin will face a struggle going forward.
Waves

Source: WAVES/USD via Trading View
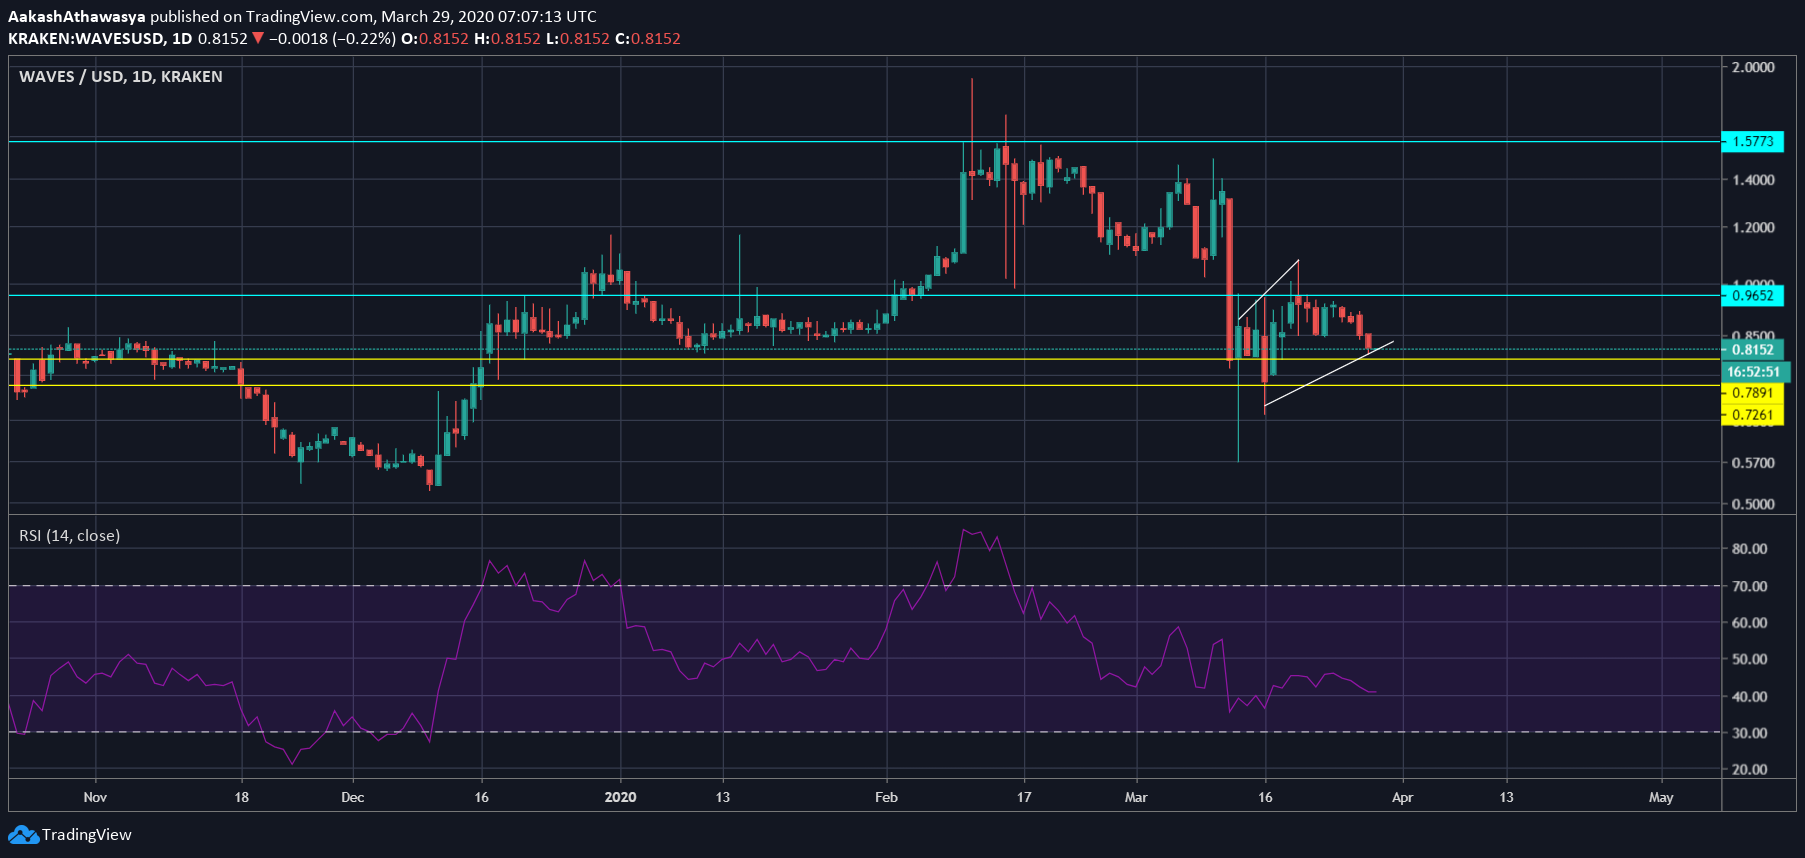
The Waves platform cryptocurrency, has seen a roller coaster ride since the beginning of 2020, and now is right back to where it started. Since breaking $1 and then $1.5 in February and March, the coin went down with the Bitcoin drop, losing almost 40 percent of its value, and is now trading at $0.815.
Support lines lie at $0.789 and $0.726, while a short term resistance line is present above at $0.962, with the price firmly in between. Since the March 12 drop, the altcoin has seen a visible, albeit weak, upward channel, which is looking to alter given the dropping price since March 27.
RSI for the Waves platform cryptocurrency has been dropping since mid-February, indicating a surging selling pressure, and now is at 40.74 a marginal recovery from 33.9 where it stood on March 14.
