Tron, Algorand, Dogecoin Price Analysis: 12 October

Tron could be set to continue its downtrend on its charts, despite the fact that the sentiment around many altcoins appeared to shift to the bullish side. The Crypto Fear and Greed Index noted a neutral reading of 52 at press time, compared to the previous day’s ‘greedy’ value of 55. Further, while Algorand looked likely to make further gains over the next few days, Dogecoin might see its smaller gains wiped out.
Tron [TRX]

Source: TRX/USDT on TradingView
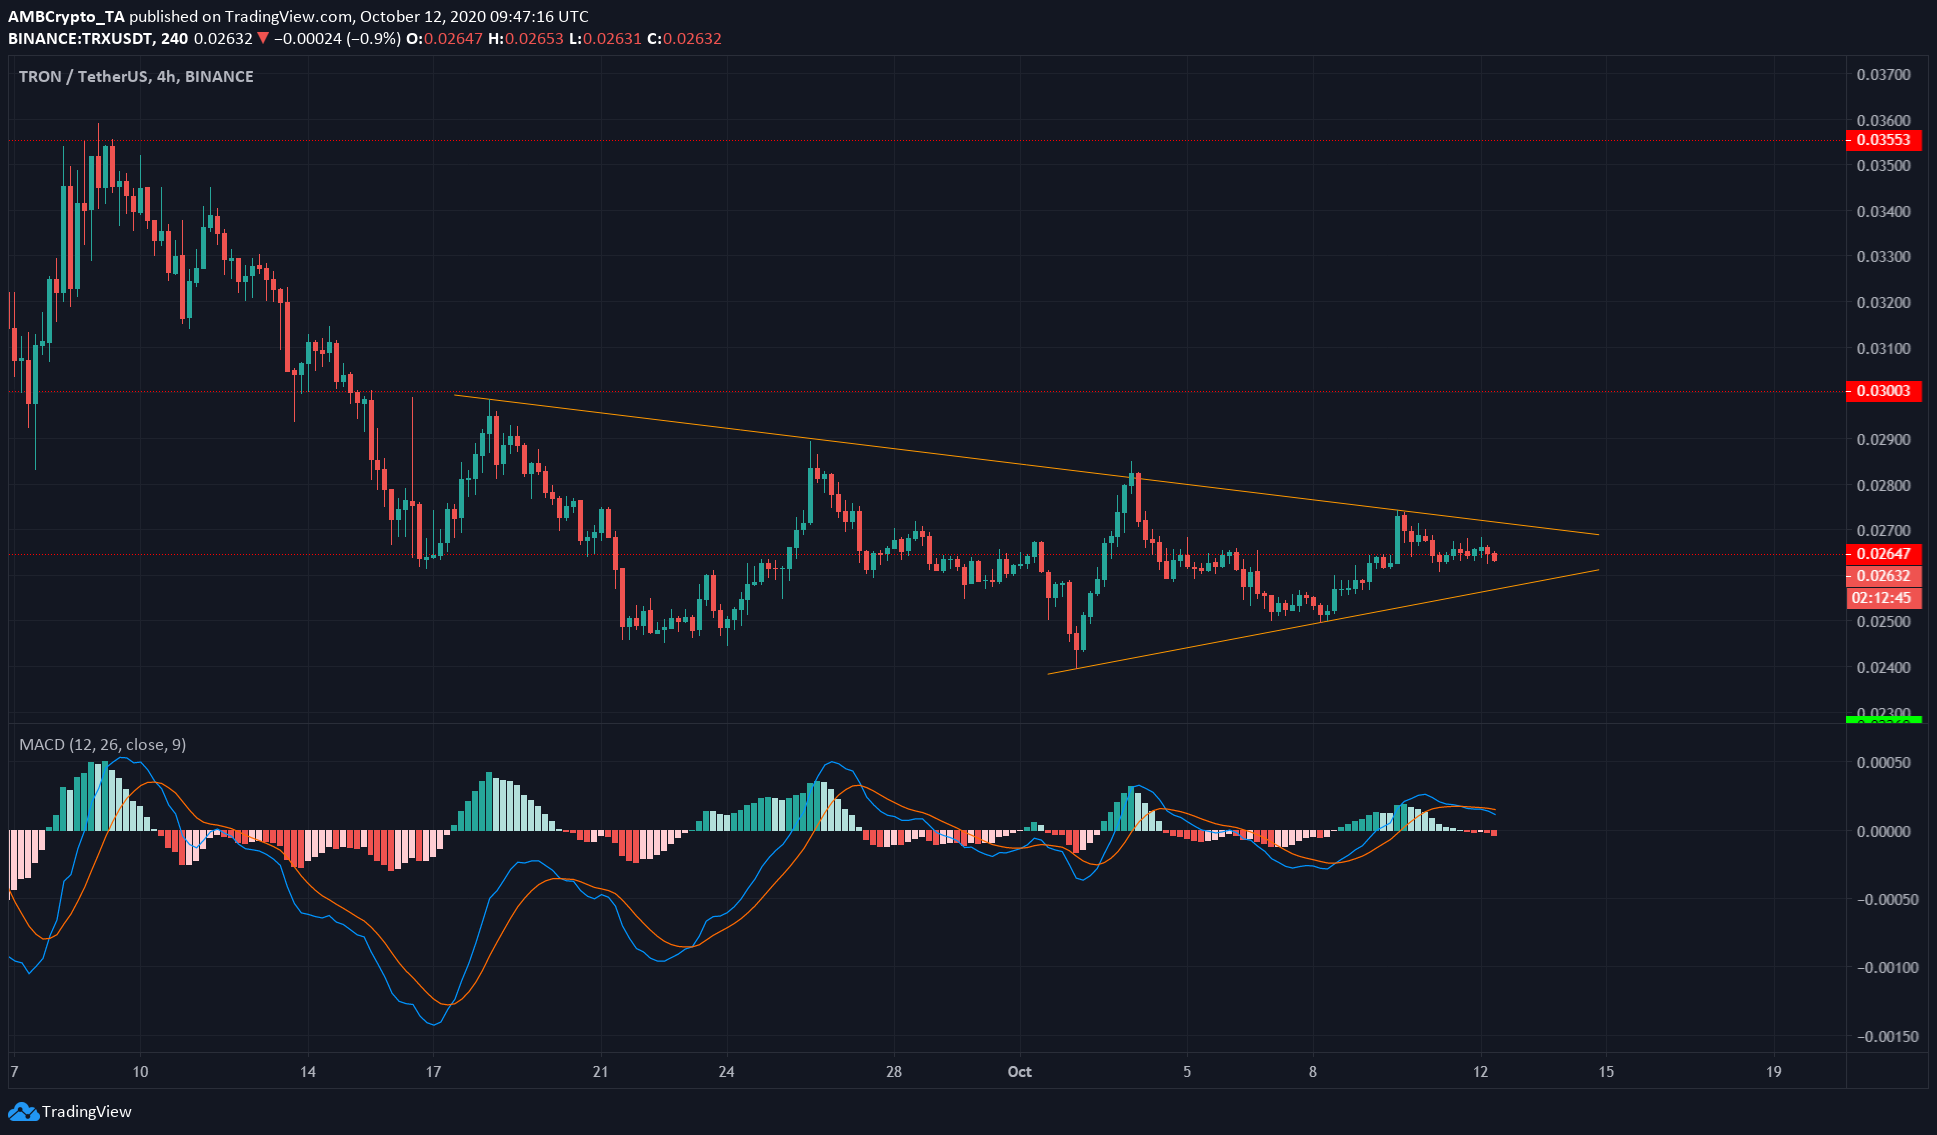
Tron was in a downtrend and at the time of writing, was near the end of a symmetrical triangle pattern. A break below the pattern seemed likely while a break above the same would invalidate the pattern.
This pattern is a continuation pattern that generally sees the prior trend resume; in this case, a downtrend.
The MACD gave a weak sell signal as it formed a bearish crossover above zero. A move under zero would be a stronger indicator of a drop in the cryptocurrency’s price.
Tron Foundation’s Justin Sun recently tweeted that Bitcoin on the Tron Network was pegged 1:1, and would be used to “inject Bitcoin’s value to the TRON Network and power the JUST ecosystem.”
Algorand [ALGO]

Source: ALGO/USD on TradingView
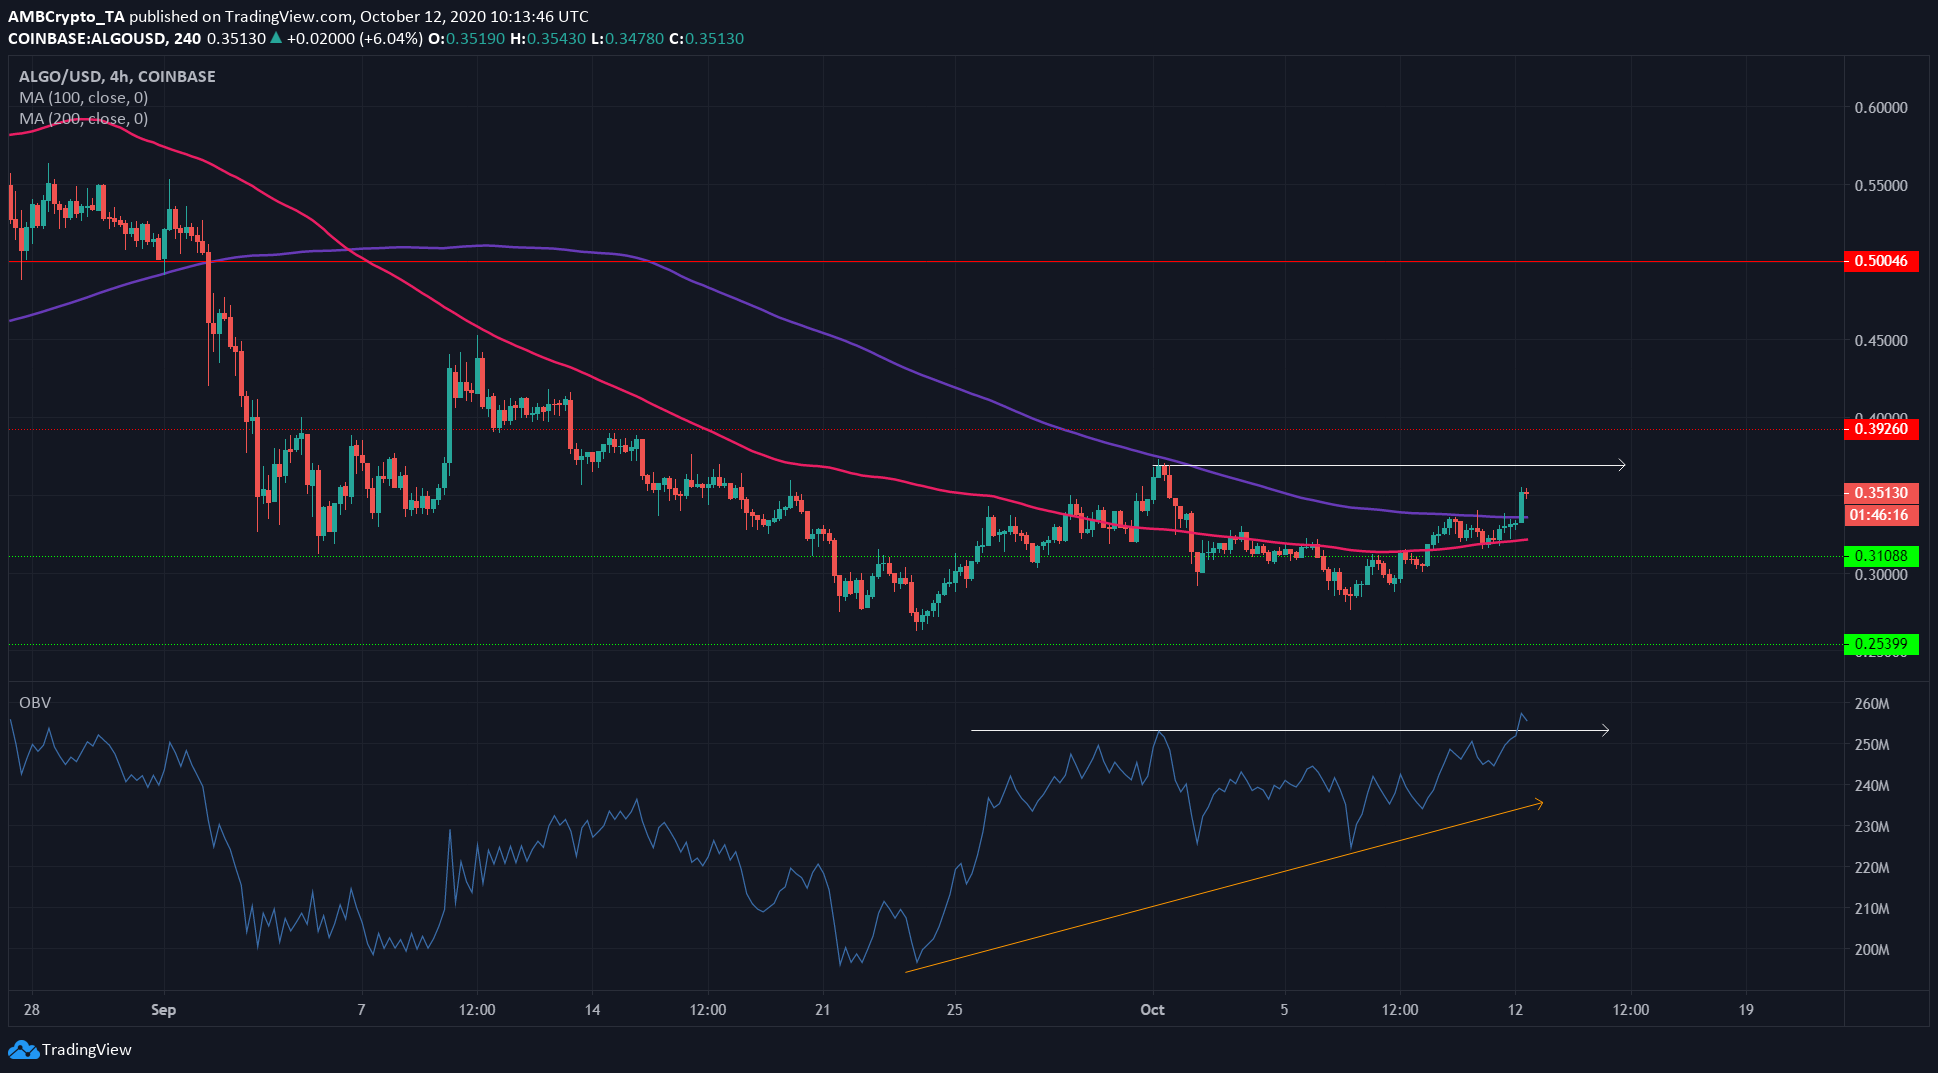
Algorand flipped its level of resistance at $0.31 to support. In the subsequent hike to $0.351 at press time, ALGO moved north of both the 100 and 200 SMA (pink and purple, respectively). This suggested that ALGO could have initiated a reversal of the bear trend it has been on since mid-August.
However, this could take weeks to bear fruit and was only an early indication of a possible trend shift.
More tangible were the findings based on the OBV. The recent buying volume caused the OBV to surge past its previous high (white) while the price was yet to follow. The price of a crypto-asset usually goes in the direction of the buyer or seller, whoever controls the market.
Taken together, this was bullish news for the asset in both the short and long term. The next major region of resistance for ALGO lay at $0.392.
Dogecoin [DOGE]

Source: DOGE/USDT on TradingView
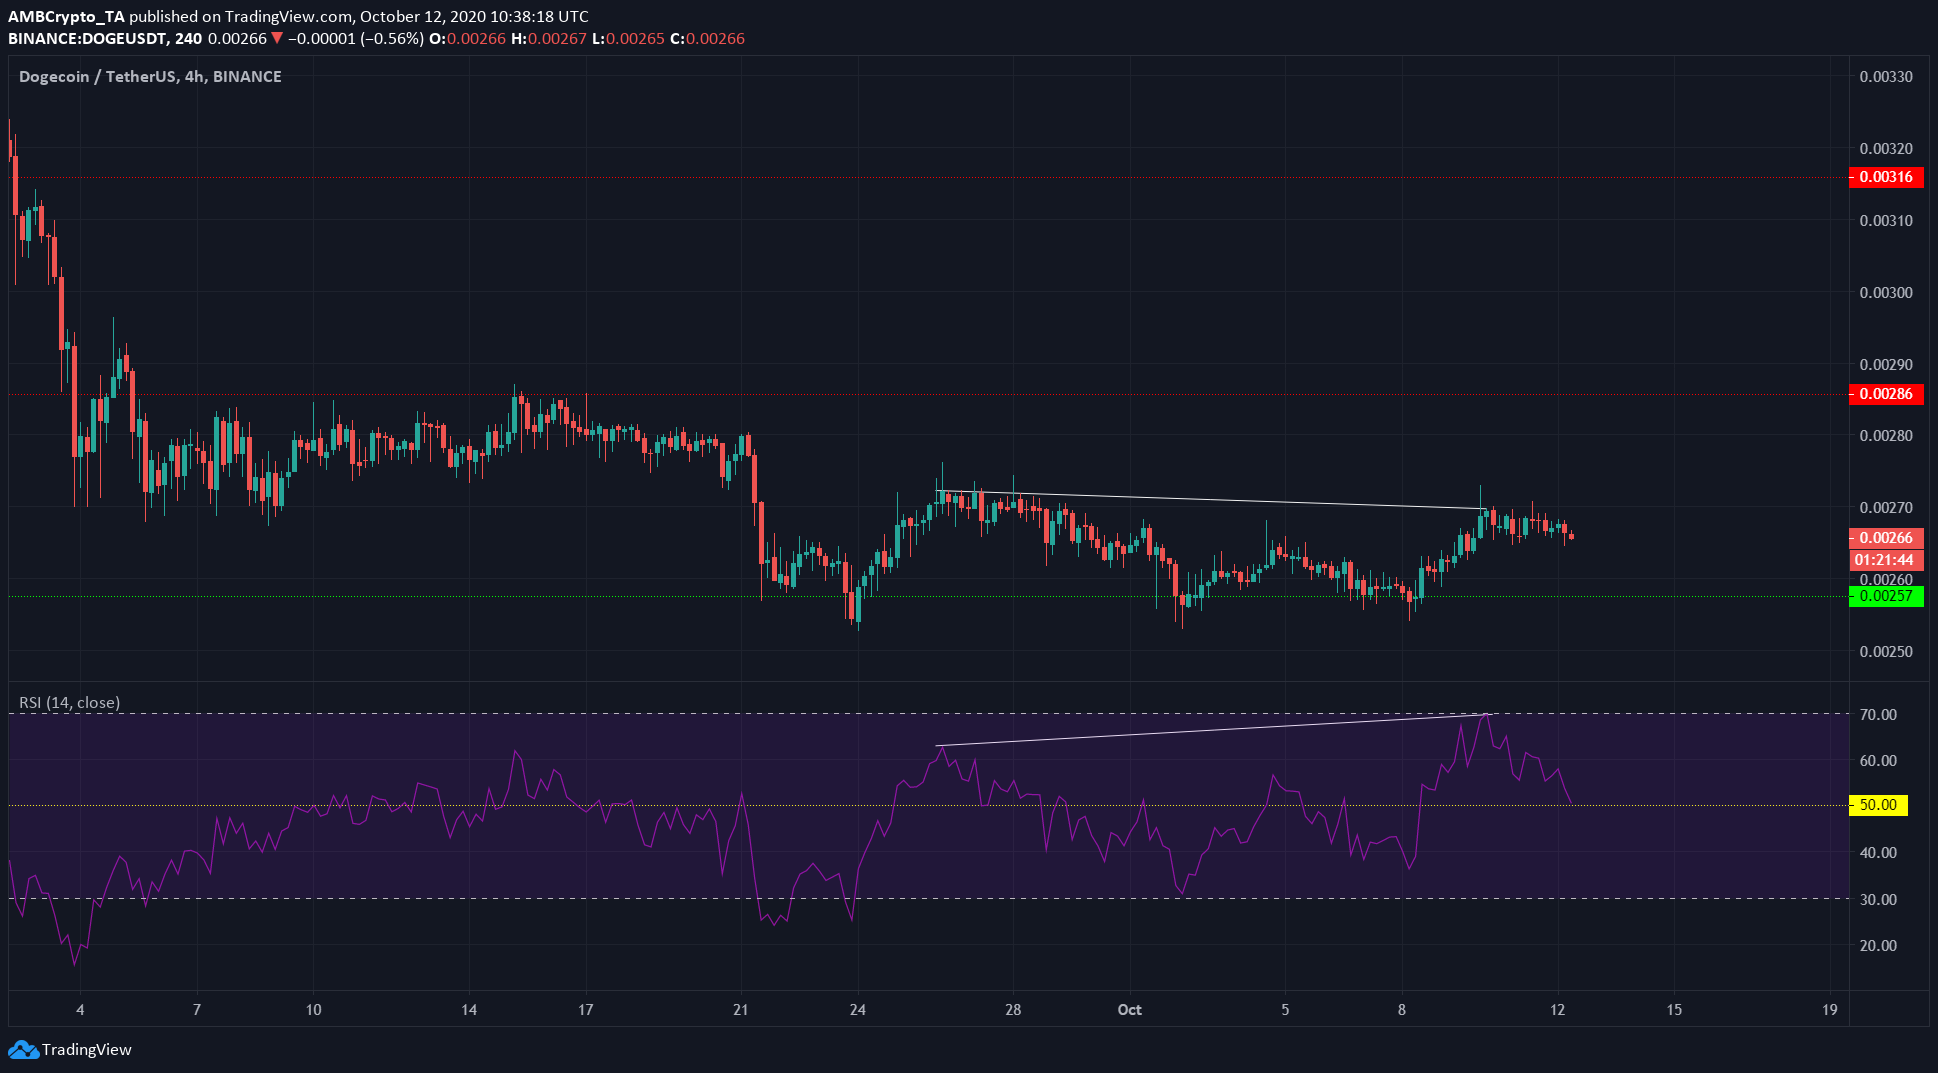
DOGE formed a hidden bearish divergence, one that suggested that the asset would continue its prior downtrend. Shown in white, the price made lower highs as the momentum indicator (RSI) made higher highs.
For the better part of the past two months, the RSI has been below or around the neutral value of 50. This suggested that the trend was predominantly bearish, with brief periods of respite.
The recent climb to $0.0027 from $0.00255 was likely to have been a bounce, and DOGE could be set to lose the support around the $0.00255 region.


