
Disclaimer: The information presented does not constitute financial, investment, trading, or other types of advice and is solely the writer’s opinion.
- Steady buying pressure meant that TIA was likely to climb higher.
- The Fibonacci extension levels gave some profit-taking targets to bulls.
Celestia [TIA] climbed higher on the price charts even as the rest of the altcoin market saw a short-term pullback. The token has gained 160% in the past five days and its uptrend seems likely to continue.
The token was launched in late September and was listed on multiple centralized crypto exchanges on the 31st of October. Its trading was uneventful in the first few days, but the bullish strength was resounding in the past week.
The retest of the $4.2 support meant that TIA is likely headed much higher

Source: TIA/USDT on TradingView
From the 31st of October to the 10th of November, TIA traded well under the $3 resistance level. Its breakout past that mark and subsequent retest of the $3.16 level paved the way for further gains.
The move from $3.16 to $5.97 in the past few days was used to plot a set of Fibonacci retracement levels (pale yellow).
On the 13th of November, TIA saw a retracement to the $4.237 level. This was precisely where the 61.8% Fibonacci retracement level was also at.
After the pullback, TIA moved above the $6 mark. This was a sign of strong bullish intent. It meant that the rally could extend to the 61.8% and 100% retracement levels at $7.72 and $8.8.
The RSI was at 63, which reflected strong upward momentum. The On-Balance Volume (OBV) has trended firmly higher. Additionally, the Chaikin Money Flow (CMF) was also above +0.05 to show significant capital flow into the market.
Gauging the lower timeframe sentiment behind TIA
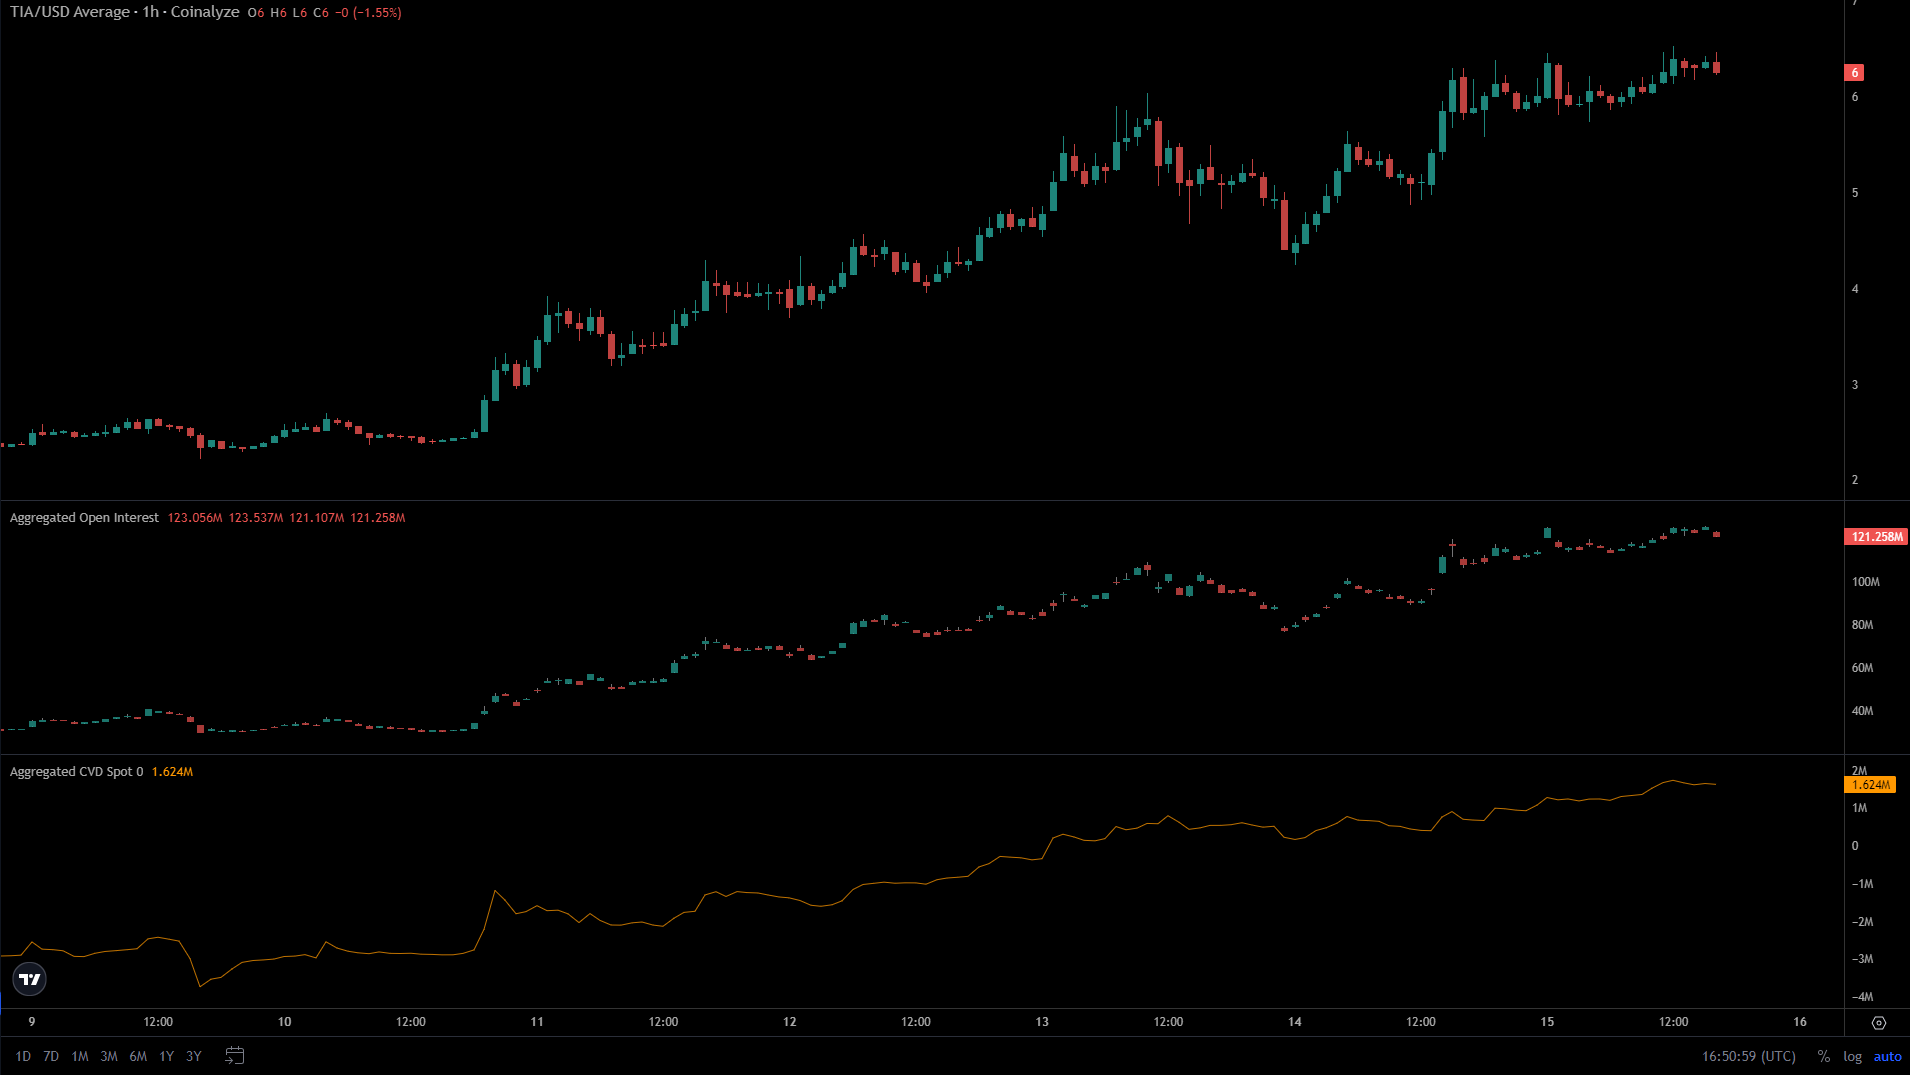
Source: Coinalyze
Is your portfolio green? Check out the TIA Profit Calculator
As TIA trended higher, so did the Open Interest (OI). This outlined strong bullish sentiment in the market. In recent hours, the OI tapered off slightly as the price of the token hovered about the $6 zone.
The spot CVD was surging higher. Like the OBV, this indicator noted hefty buying pressure. This reinforced the idea that demand in the spot markets remained high. Hence, TIA has a good chance of making further gains.


![Celestai [TIA] news](https://eng.ambcrypto.com/wp-content/uploads/2023/11/Celestia__1200x900-400x240.webp)