Bitcoin
This one key Bitcoin metric holds the cards to the bull run

Bitcoin crossed $12,000 and slid under the range, yet again. Speculation with respect to an imminent bull run is almost unavoidable at the moment. With every key metric turning plush green every day, for more proponents, the next big rally for Bitcoin is seemingly around the corner.
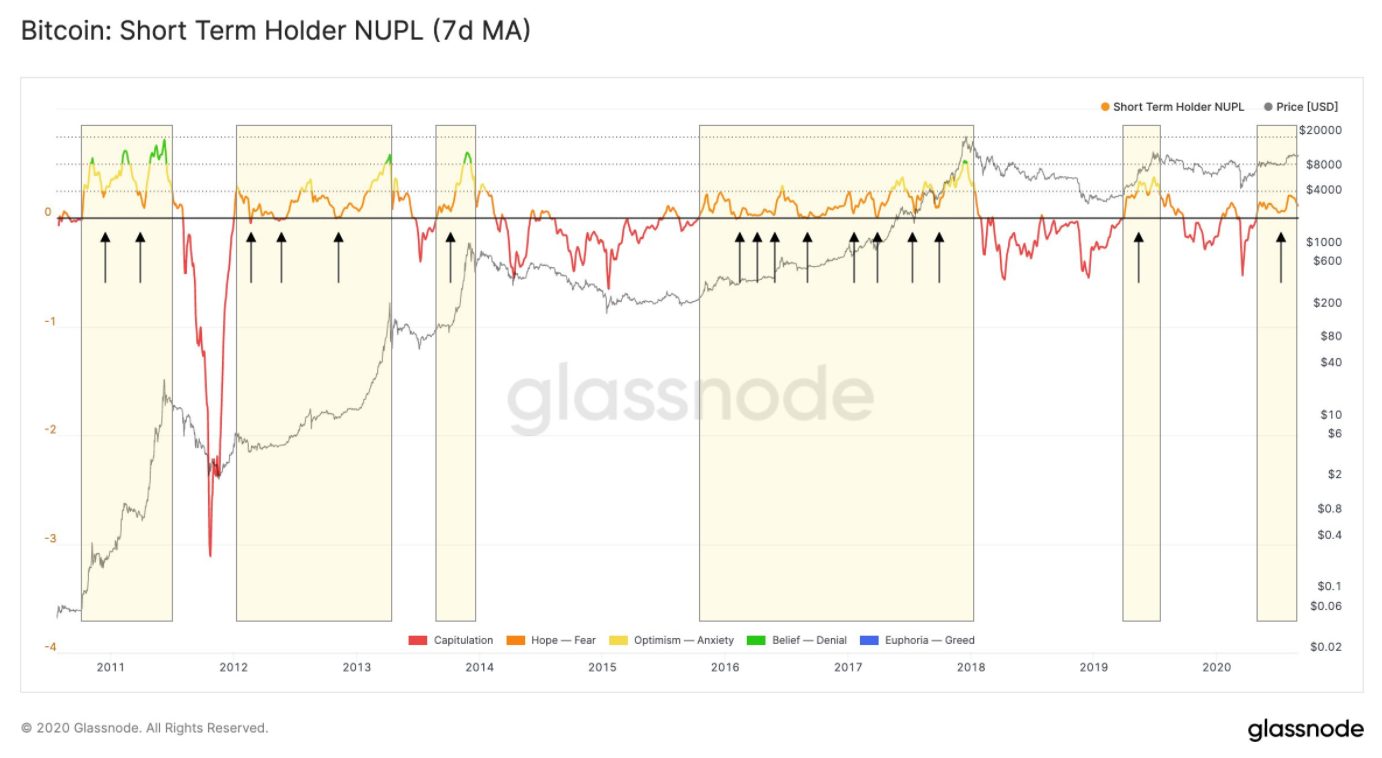
Bitcoin’s Short-Term Holder metric conveyed the same sentiment at press time.

Source: Twitter
According to the above glassnode chart, BTC’s Net Unrealized Profit/Loss (NUPL) has now held a positive position for a good part of the last four months. Glassnode Founder Rafael Schultze-Kraft stated that historically such a scenario has been identified with previous bull runs and he indicated that it puts BTC is a similar “pre-bull run” position once again.

Source: Arcane Research
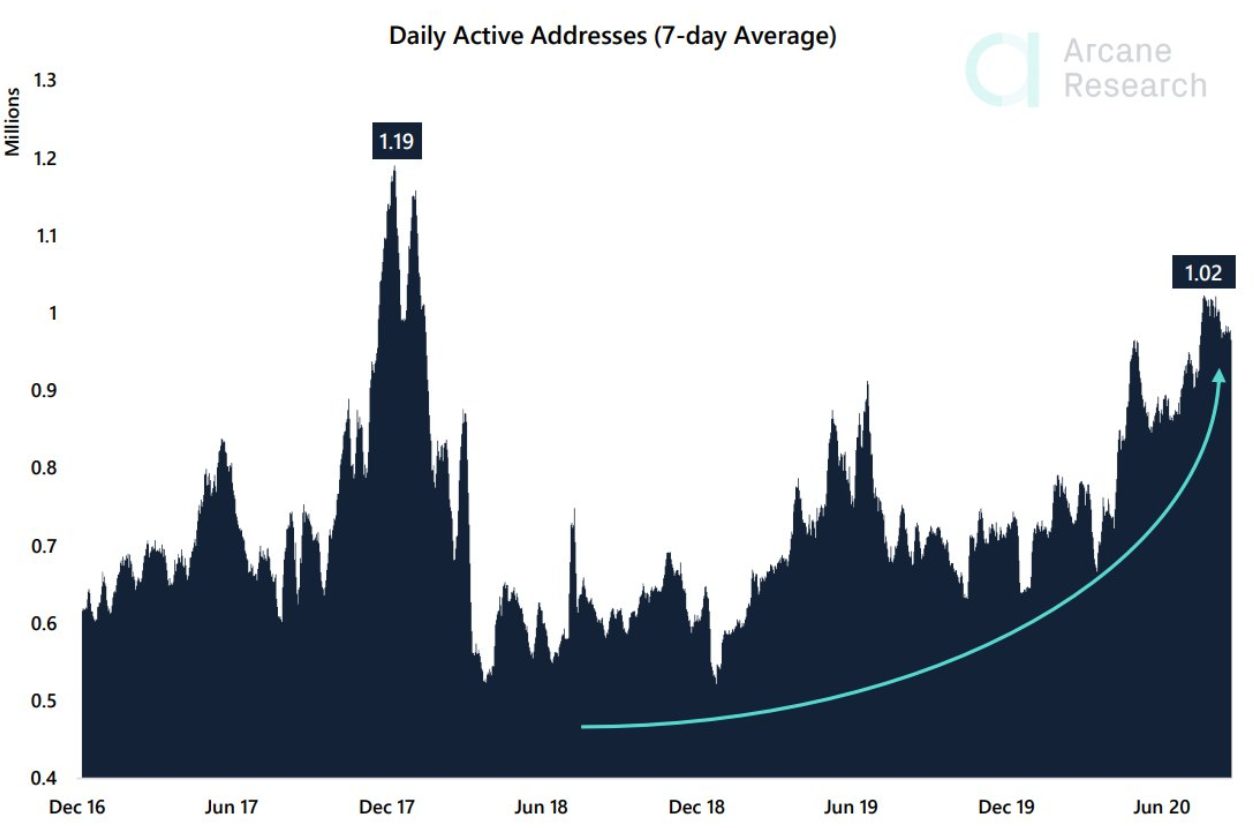
Bitcoin’s activity rates were inclining towards a rally as well. As indicated by Arcane Research, Bitcoin Daily Active Addresses are reaching levels last witnessed during the 2017 rally, surpassing any activity witnessed last year in 2019.
The case for a bull run could not be made stronger and considering so many stars are aligning together, the breakout seems inevitable. However, that might not be the case after all.
Bitcoin bull run-at the back of low volatility?
Source: Skew
While positive metrics made the headlines, a current development with respect to Bitcoins Realized Volatility seemed to have slipped right past the industry. At press time, BTC Realized Volatility is at a yearly low of 2.2%. In comparison, the last time realized volatility was tracked back to November 2016.
Now, speaking from historical relevance, no bull run in BTC’s history has unfolded from such subdued levels of volatility. Now, this may open up the discussion in two particular directions.
False Alarm on the Bitcoin rally or extended consolidation? Take your pick
Not disregarding the importance of other fundamental metrics but the lack of volatility is a huge red flag from a bull run Point-of-View. Such a situation may also indicate that this particular consolidation between $10,000-$12,000 could be stretched out for an extended period of time. In the meantime, it may also indicate that a reversal would create the momentum to take the price up, but the price may flip downwards as well.
After accounting for all these variables, it is safe to say that we might be close to a bullish rally but not close enough, just yet.

