The last few days have seen the crypto-market note a trend reversal of sorts. While most large-cap cryptos like Bitcoin and XRP finally saw some price movement that pushed these cryptos up the charts, few of the past few months’ best-performing cryptos like Chainlink and Tezos registered corrections. The latter’s movement was especially interesting since the larger market was moving in the opposite direction.
XRP

Source: XRP/USD on TradingView
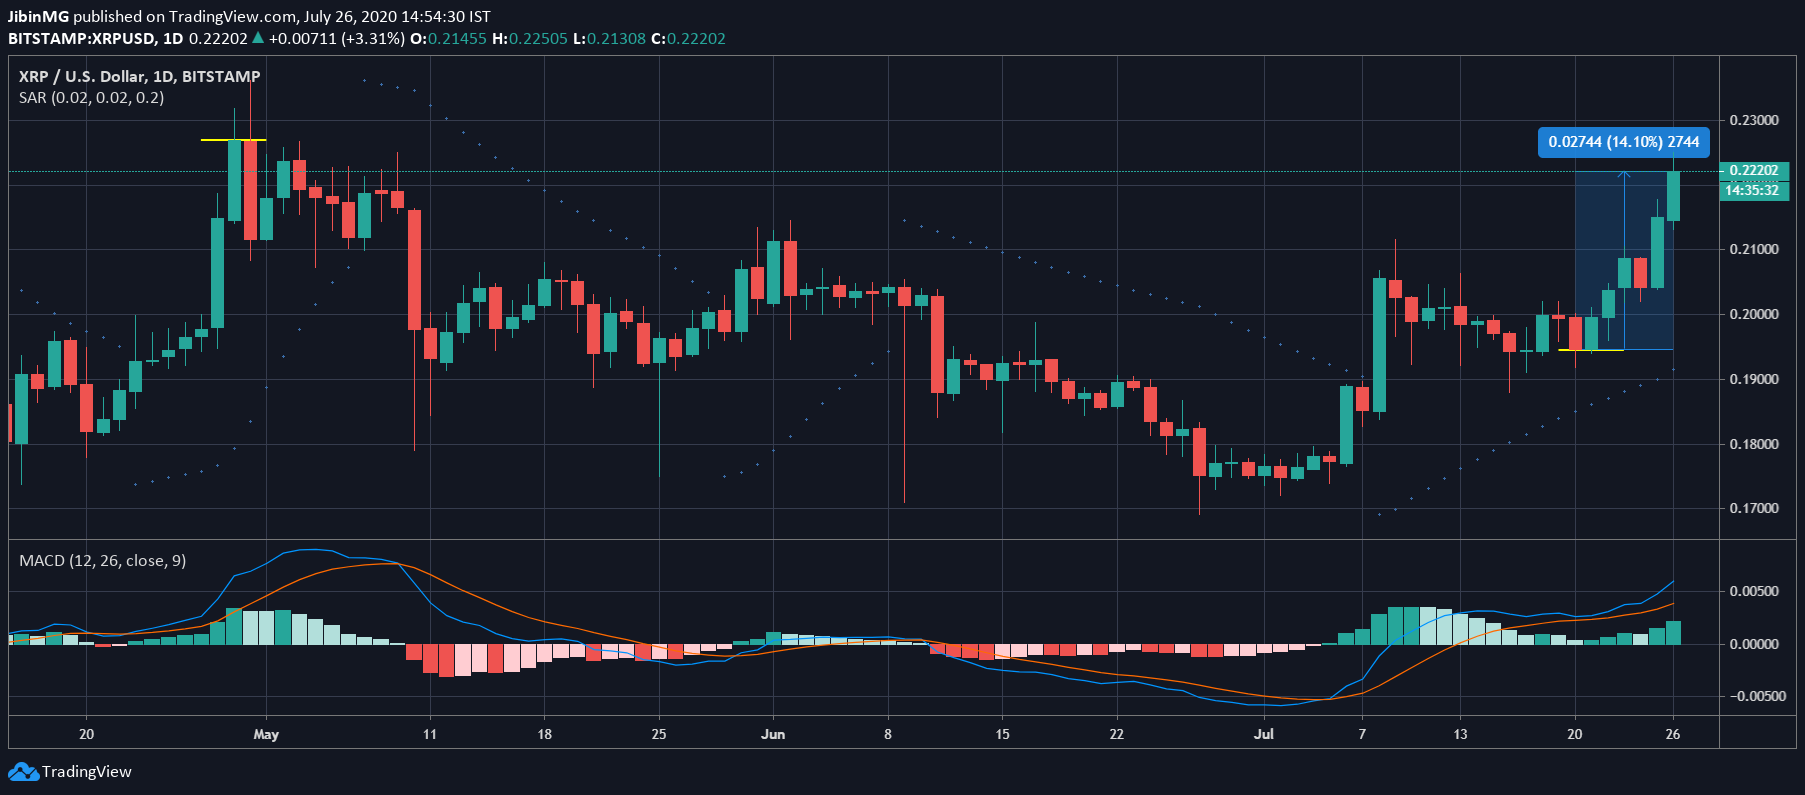
XRP, formerly the third-largest cryptocurrency in the market, had been down recently after it was overtaken by Tether [USDT] on the charts. However, at press time, it seemed like XRP was on the road to recovery since the crypto took advantage of Bitcoin’s hike to register gains of its own. In fact, XRP has surged by over 14% on the charts over the past 7 days.
XRP’s recent hike isn’t driven by Bitcoin’s surge alone. In fact, according to many, Ripple and XRP may be the biggest beneficiary of the OCC’s decision to allow banks to offer crypto-custody services.
The crypto’s technical indicators underlined the bullishness in the XRP market. Parabolic SAR’s dotted markers were well-positioned under the price candles and MACD line was holding steady above the Signal line on the charts.
Tezos [XTZ]

Source: XTZ/USD on TradingView
Tezos, the cryptocurrency ranked 13th on CoinMarketCap’s charts, has been one of the year’s best-performing crypto-assets. In fact, at the time of writing, XTZ was noting YTD gains of over 125%. While some would argue that Tezos was one of the alts to drive the market’s performance over the last few months, that hasn’t been the case over the last few days.
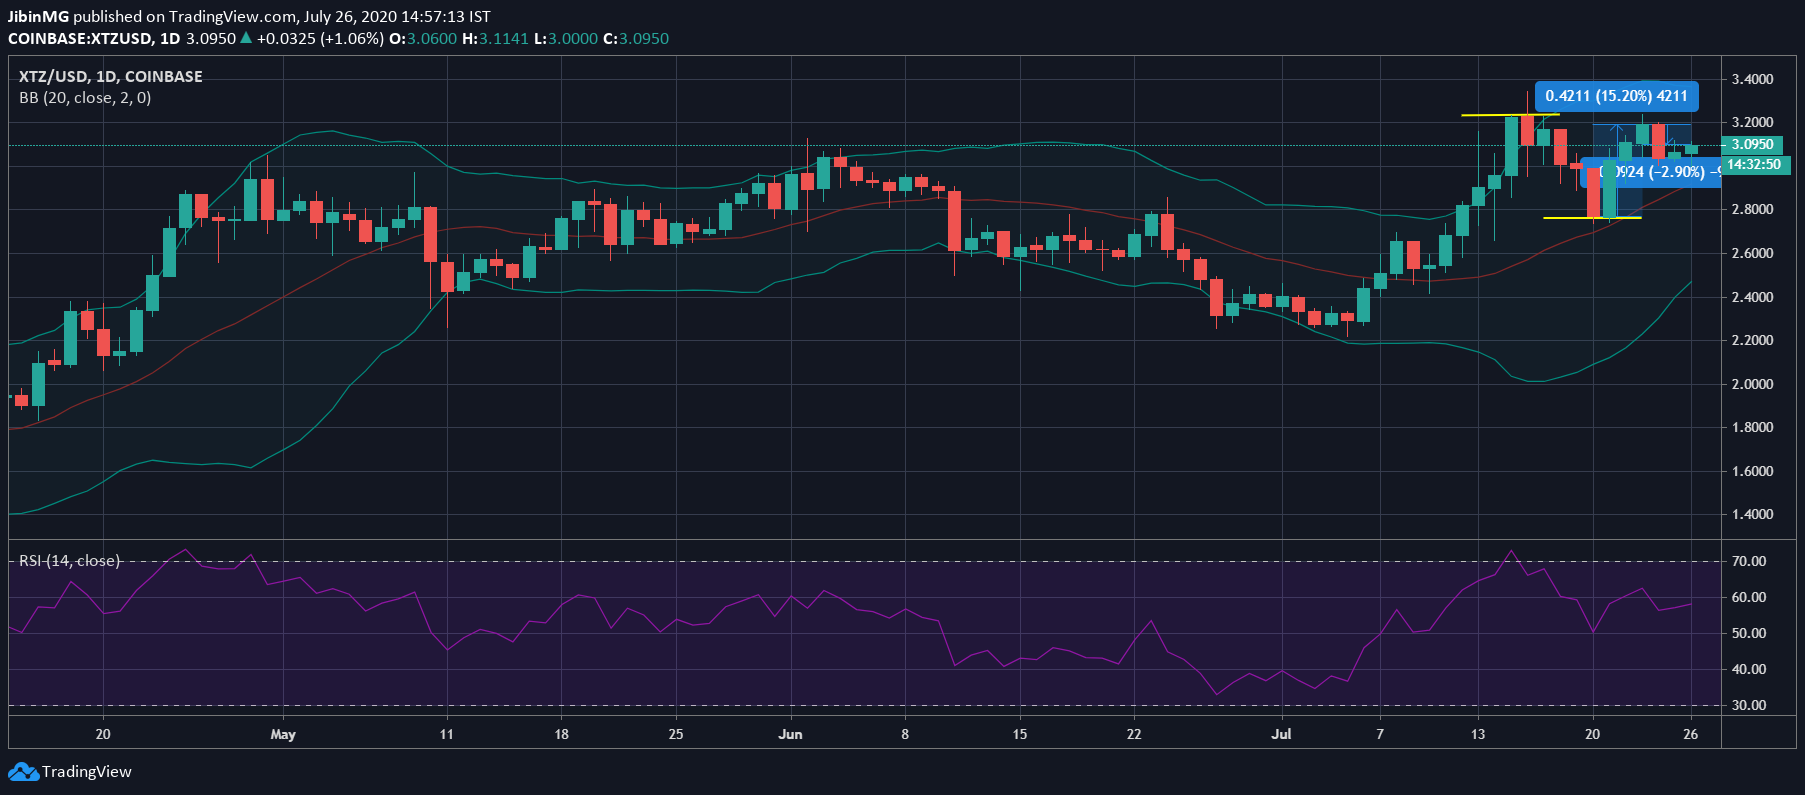
In fact, after reversing a correction wave and climbing by over 15% on the charts, XTZ has fallen by almost 3% in the last few days, quite contrary to the movement of XRP, for example.
The mouth of Bollinger Bands was wide and highlighted the degree of volatility in the Tezos market. On the other hand, despite the same, Relative Strength Index remained fairly in the balance between the oversold and overbought zones.
Tezos was in the news recently alongside the likes of EOS, after it was chosen to be integrated with China’s Blockchain-based Service Network.
Chainlink [LINK]

Source: LINK/USD on TradingView
Like Tezos, Chainlink has been one of the market’s best-performing cryptos, with the 11th-ranked crypto registering YTD gains of 334%, at the time of writing. Like Tezos, LINK too touched its local top on the chart recently, before correction waves swept it away.
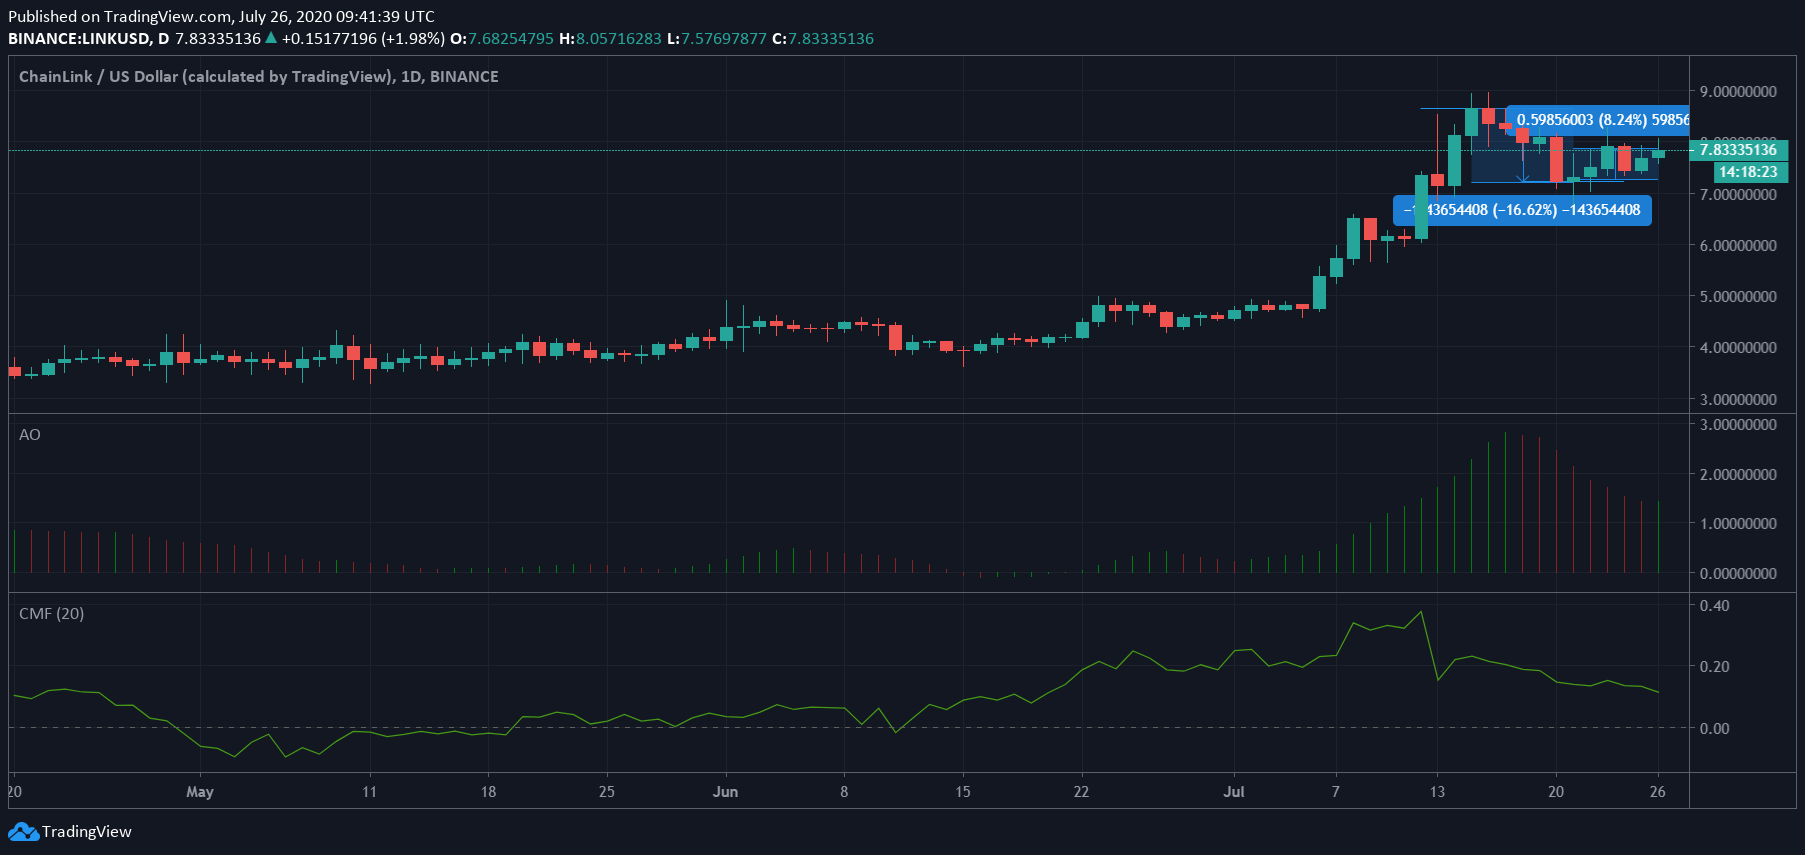
However, these corrections were soon followed by gains, with LINK climbing by over 8% on the charts. It must be noted, however, that most of the crypto’s appreciation was registered prior to the market surge that followed the OCC’s announcement.
Awesome Oscillator pictured falling momentum in the LINK market, with the indicator’s histogram reflecting a mix of both bearish and bullish signals. Further, Chaikin Money Flow was continuing to drop on the charts, implying that capital outflows were steadily growing.
With LINK’s price surging on the charts for the past few months, it is no wonder therefore that the crypto’s popularity and social media presence have also risen exponentially, according to CryptoCompare.
