Analysis
STEEM, Polkadot, Ethereum Price Analysis: 12 September

Ethereum flipped a level of resistance to support, after rising from the lows of $320 on the charts. Even in combination with Bitcoin’s resolute hold so far on $10,000, the Crypto Fear and Greed Index was reading 41, a sign of fear in the market. While some altcoins struggled to shrug off bearish pressure in the aftermath of the market-wide slump. Polkadot and Steem appeared to have begun an uptrend. However, they might not maintain the trend if Bitcoin does not begin making gains as well.
Ethereum [ETH]

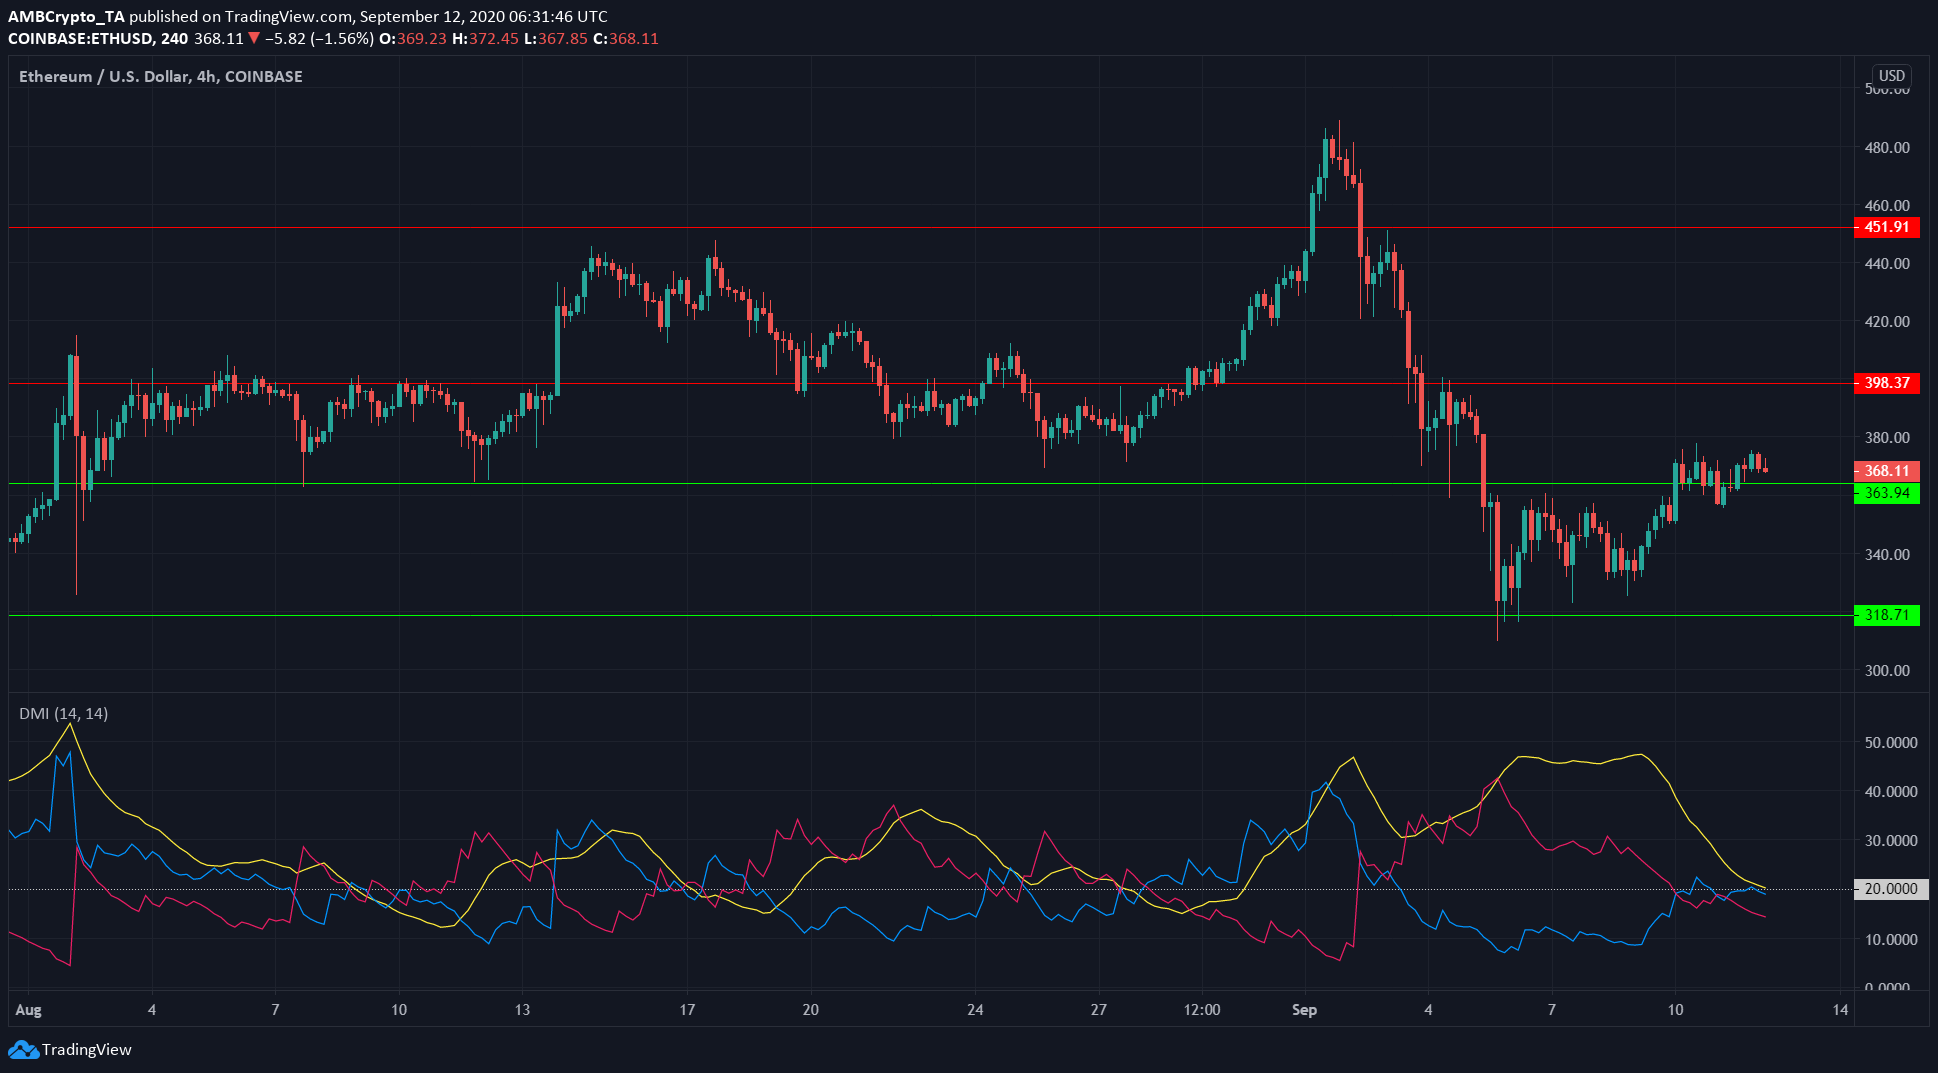
Source: ETH/USD on TradingView
Ethereum was trading above its support at $363, at press time. It appeared to have flipped the level from resistance to support and could re-test the level in the next few trading sessions.
The Directional Movement Index showed that bullish bias was beginning as the +DMI (blue) rose above the -DMI (pink). The ADX (yellow) was at 20, which is the threshold many traders use to signify a strong trend.
It is likely Ethereum will consolidate at the support level for some more trading sessions, before gaining upside momentum.
In other news, ERC-20 tokens’ market cap have ‘flipped‘ Ethereum’s.
Polkadot [DOT]
Source: DOT/USD on TradingView
Polkadot was forming an ascending triangle beneath its resistance at $4.80. It was being bought at higher prices, closer to the resistance level, as shown by the higher lows DOT registered over the past few days.
This made it likely that price would rise above its resistance, perhaps re-testing the flipped level, before moving towards the next level of resistance at the $5.5-level.
The Awesome Oscillator, however, showed that the recent move north for DOT was slow and lacked momentum. Whether DOT surges past its resistance or gets rejected by it, some traders will be waiting on the sidelines for the market to decide on a direction, before stepping in to work towards a surge or a drop.
Steem [STEEM]
Source: STEEM/USD on TradingView
STEEM’s price rose above its 20 SMA (white) as the 20 SMA crossed to the upside of 50 SMA (yellow), showing bullishness in the short-term.
The On Balance Volume also showed that the recent surge was backed by buyers’ interest. The next level of resistance for STEEM was at $0.198. If it fails to flip the resistance, STEEM could see the moving averages serve as support.
In the short-term, it appeared likely that STEEM will begin recovering on the charts.

