Solana: Why a move past $60 could happen soon

Disclaimer: The information presented does not constitute financial, investment, trading, or other types of advice and is solely the writer’s opinion.
- Solana was trading near the $60 level, which it previously tested back in May 2022.
- The higher timeframe price charts showed further upside was likely, but the market could decide to cool down and consolidate above $50.
Solana [SOL] has tested the $50 support zone twice in the past two weeks. On each occasion, the bulls have been strong enough to bring about a bounce in prices.
AMBCrypto previously reported that the protocol’s fees have increased by 103% and forecast a bullish future in the coming weeks.
Trading volume on decentralized exchanges (DEXes) within the Solana network witnessed a massive hike as well. Increased network activity was also seen, and reflected increased demand for the token.
The long-term prospects were firmly in favor of the bulls
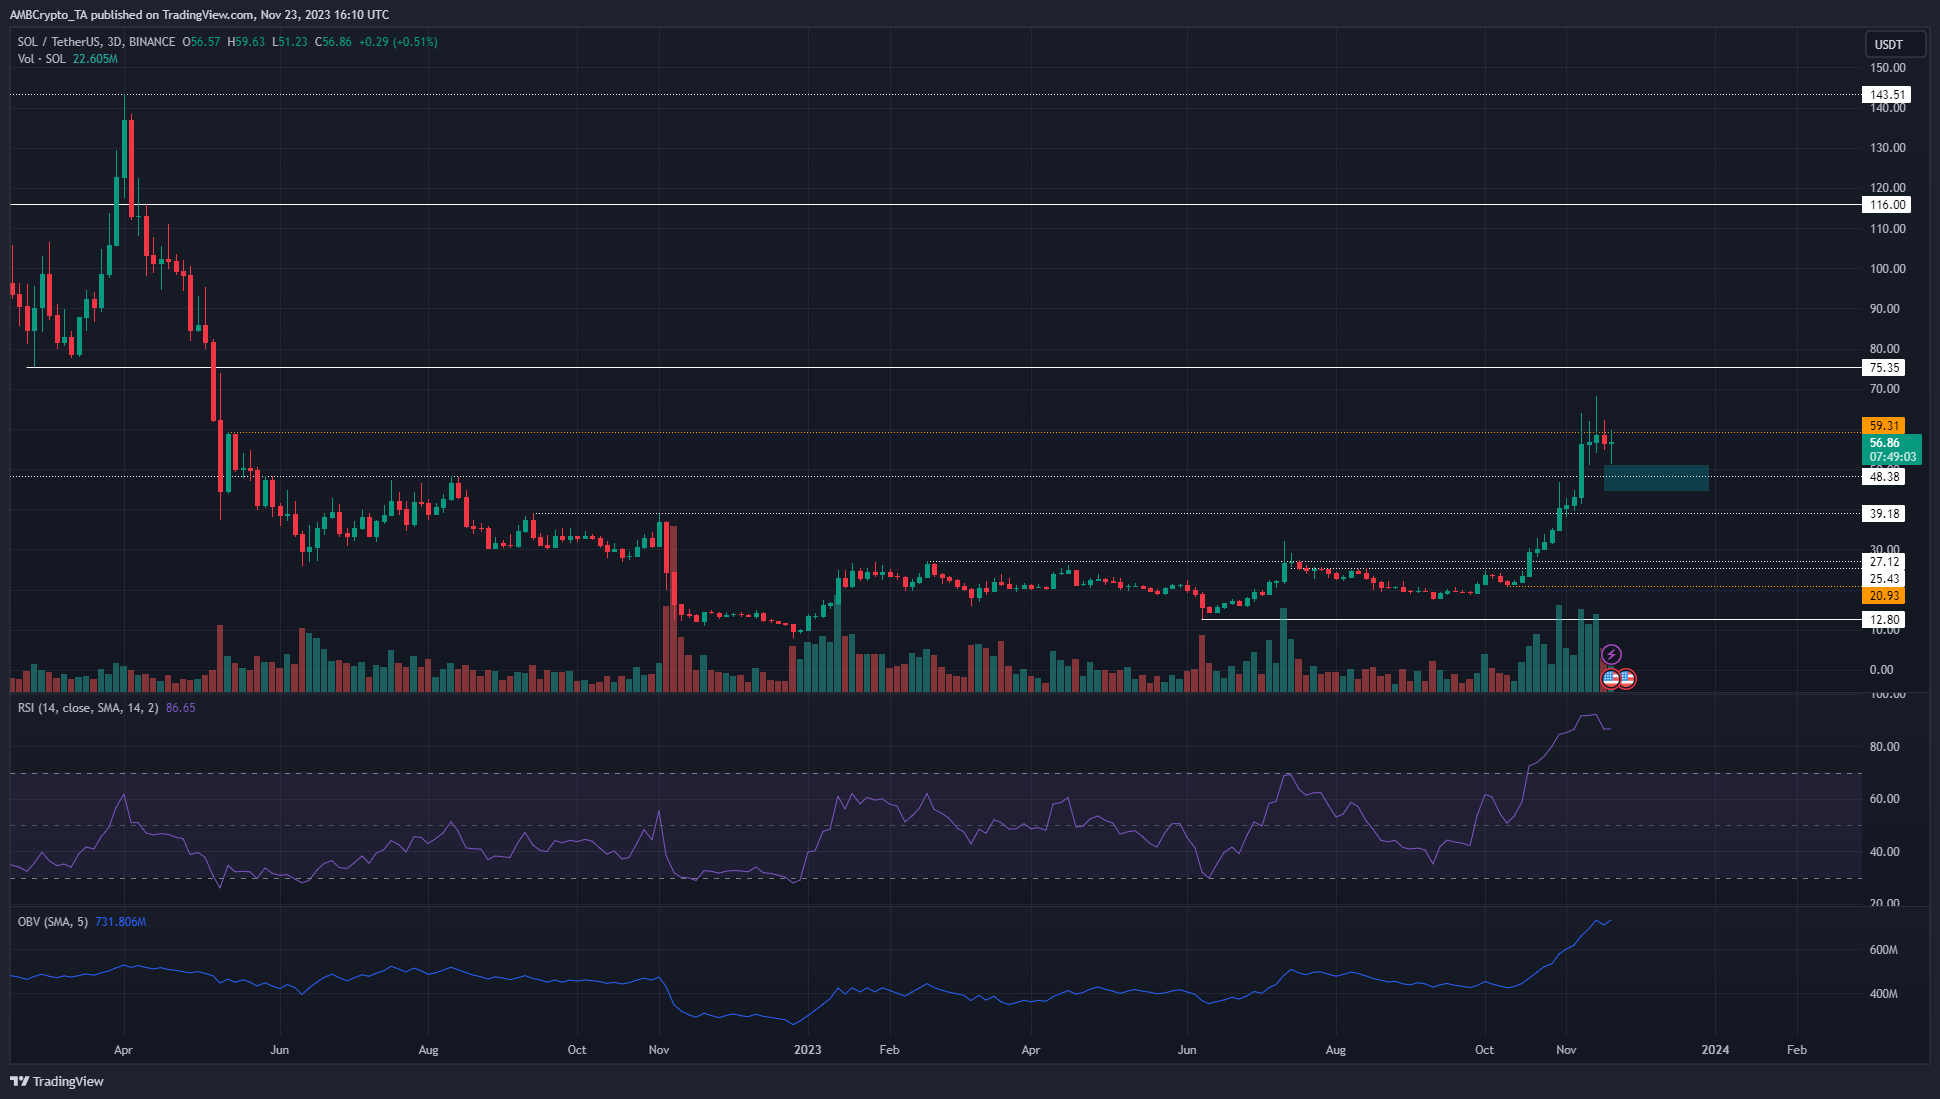
Since May 2022, the $59.3 level has not been defeated as a resistance. Back then, a temporary bounce to this level was followed by a swift move lower. This showed that $59.3 was a critical level, alongside $48.4.
The $48-$50 zone has been flipped to support in recent weeks of trading. The market structure on the one-day and three-day charts was firmly bullish. Moreover, both timeframes showed that SOL could form a range in the $50-$60 region.
The RSI on the D3 chart was well above 70 to reflect intense upward momentum, and the On-Balance Volume (OBV) hasn’t slowed down much. Hence, buying pressure was still dominant on the higher timeframes.
What can the past week’s futures market reveal?

Source: Hyblock
While the move past $50 showcased strong bullish intent, it was unclear when a breakout could occur. To the north, the $75 and $116 levels were bullish targets. Yet, before that, the $60 region must be broken.
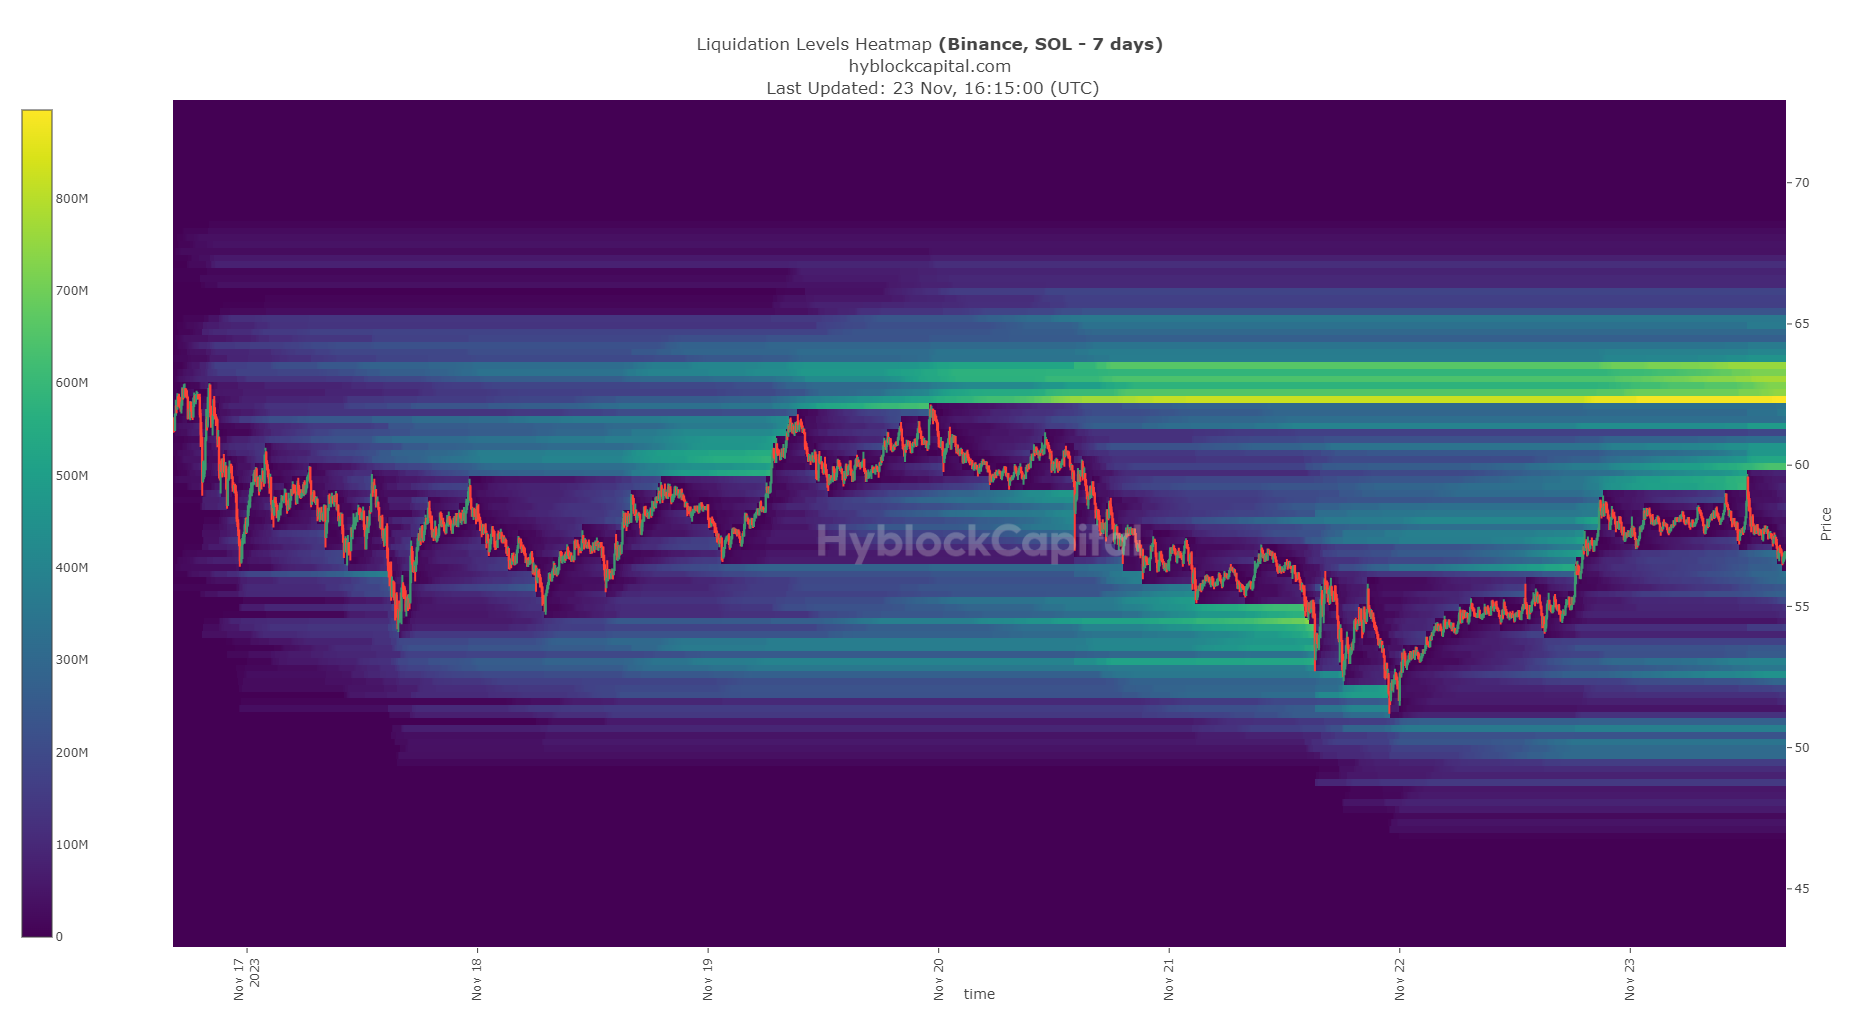
AMBCrypto analyzed the liquidation levels data from Hyblock. The heatmap showed that a large number of liquidations could be triggered upon a SOL move to $62.4-$63.5.
Read Solana’s [SOL] Price Prediction 2023-24
This coincided with the resistance at $59.3. Hence, a move past $63 and subsequent retest could offer a swing buying opportunity.
Until then, a sweep of this liquidity pool could see a Solana reversal to $50, especially if the four-hour or one-day price chart candles have large upper wicks into this area.


