Shiba Inu: Should you trust this indicator and buy SHIB today?

- Shiba Inu has a strong short-term bearish bias.
- The Fibonacci retracement levels highlighted the next area of interest for traders.
Shiba Inu [SHIB] saw a 30.2% bounce on 14th April but it was just a dead cat bounce. The price action showed a bearish structure in the lower timeframes and signaled further losses were likely around the corner.
One volume indicator differed in its findings, showing significant demand for SHIB in recent days. Will it be vindicated, or is this a false signal?
SHIB retests former support zone as resistance
The higher timeframe market structure of SHIB was bullish. However, the losses of the past few days saw it fall below the $.0000238 low from the 6th of March. Additionally, the 61.8% Fibonacci retracement level was also breached.
The past two days of trading saw Shiba Inu bounce by 30% from the swing low at $0.0000183 to $0.0000238. However, it was only a short-term boost that filled the lower timeframe price gaps. At press time, more losses appeared imminent.
The RSI was at 30.5 once more, and could soon descend below 30 to indicate oversold conditions. Conversely, the CMF was at +0.06 to signal notable capital flow into the SHIB market.
This was unlikely to lead to a recovery for the memecoin given the sentiment behind Bitcoin.
Speculators have been afraid to go long on Shiba Inu

Source: Coinalyze
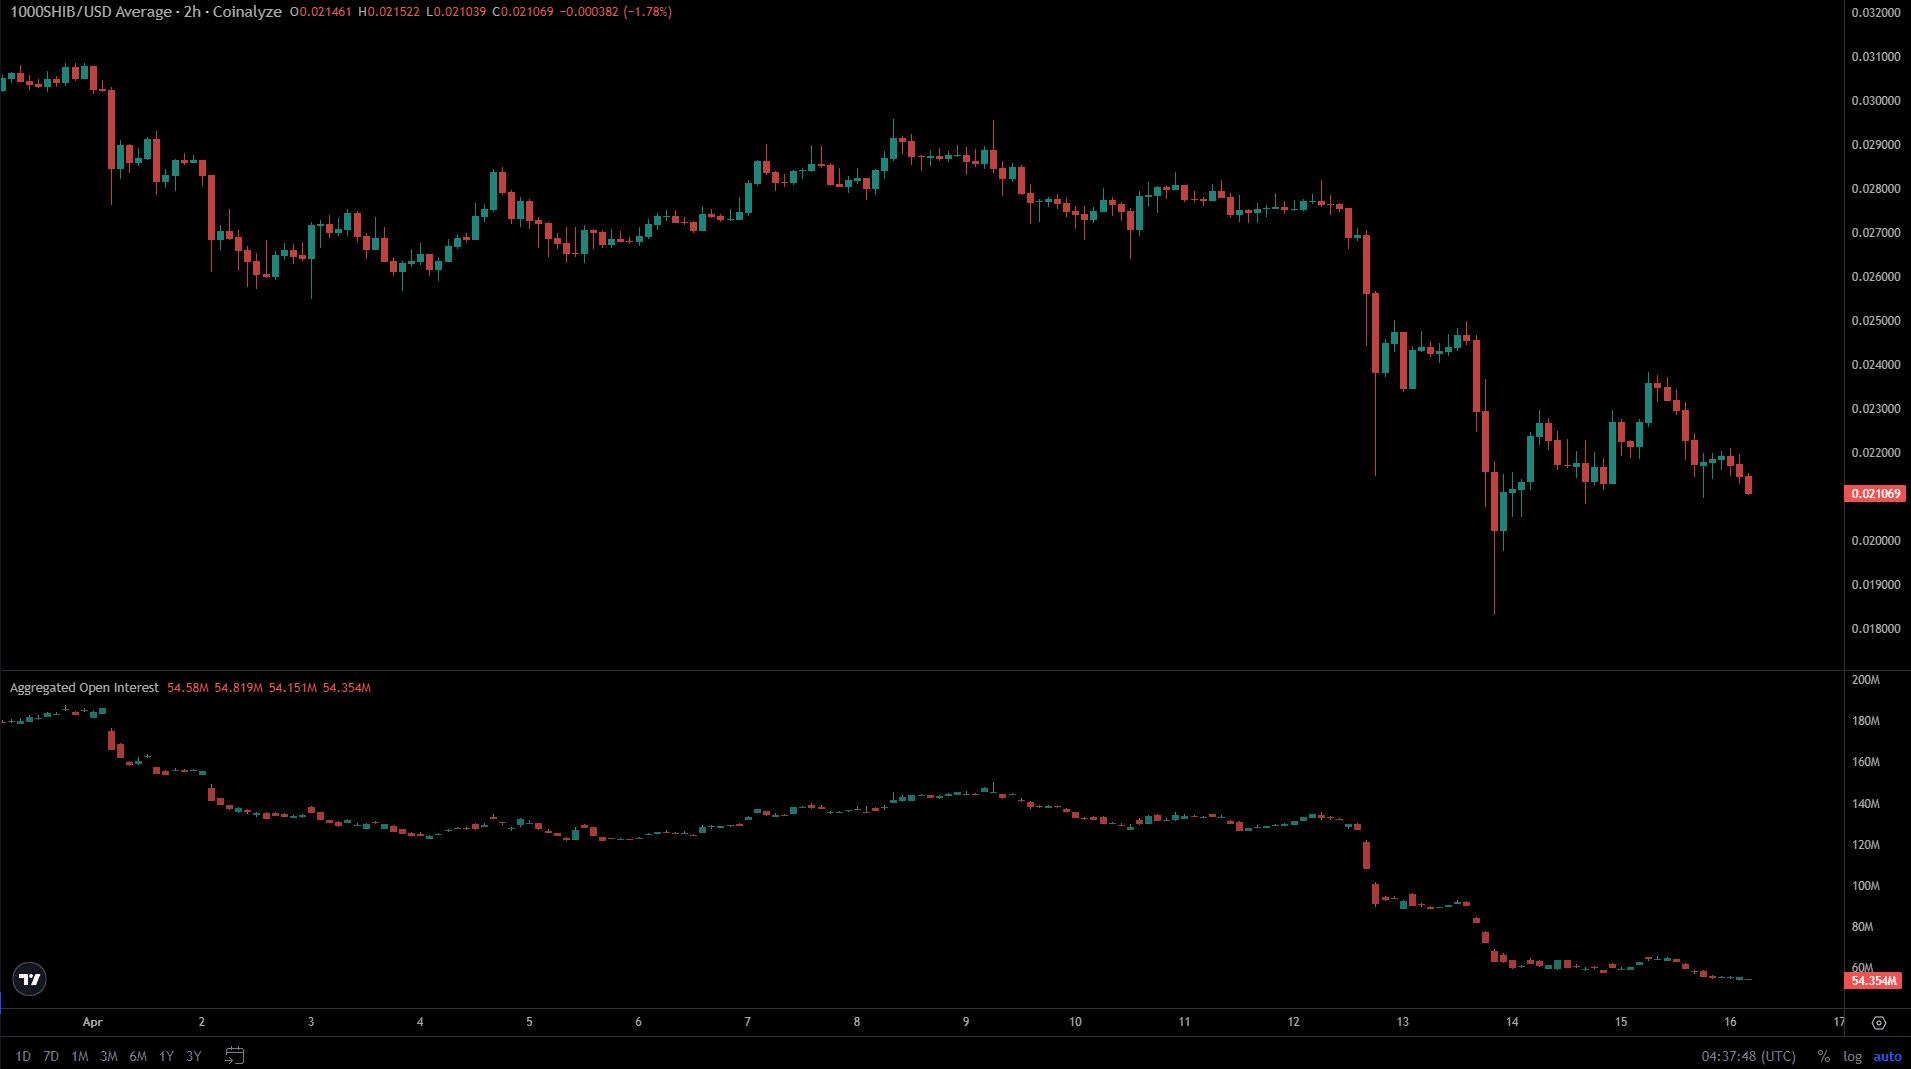
The sentiment behind Shiba Inu has been negative throughout April. The minor bounce that Shiba saw ten days ago was accompanied by a muted rise in Open Interest.
Is your portfolio green? Check the SHIB Profit Calculator
The past four days saw both prices and OI in a freefall. Therefore, speculators preferred to wait on the sidelines for the trend to change.
This showed reluctance from participants to go long on SHIB, marking a lack of conviction.
Disclaimer: The information presented does not constitute financial, investment, trading, or other types of advice and is solely the writer’s opinion.


