Analysis
Shiba Inu says ‘buy,’ but should you take its lead?
The weighted sentiment metric saw a few large upward spikes in November but remained negative for the most part.

Disclaimer: The information presented does not constitute financial, investment, trading, or other types of advice and is solely the writer’s opinion.
- Shiba Inu prices saw a large pullback within the past two weeks.
- The weekly levels showed that the bulls have the upper hand on the HTF charts.
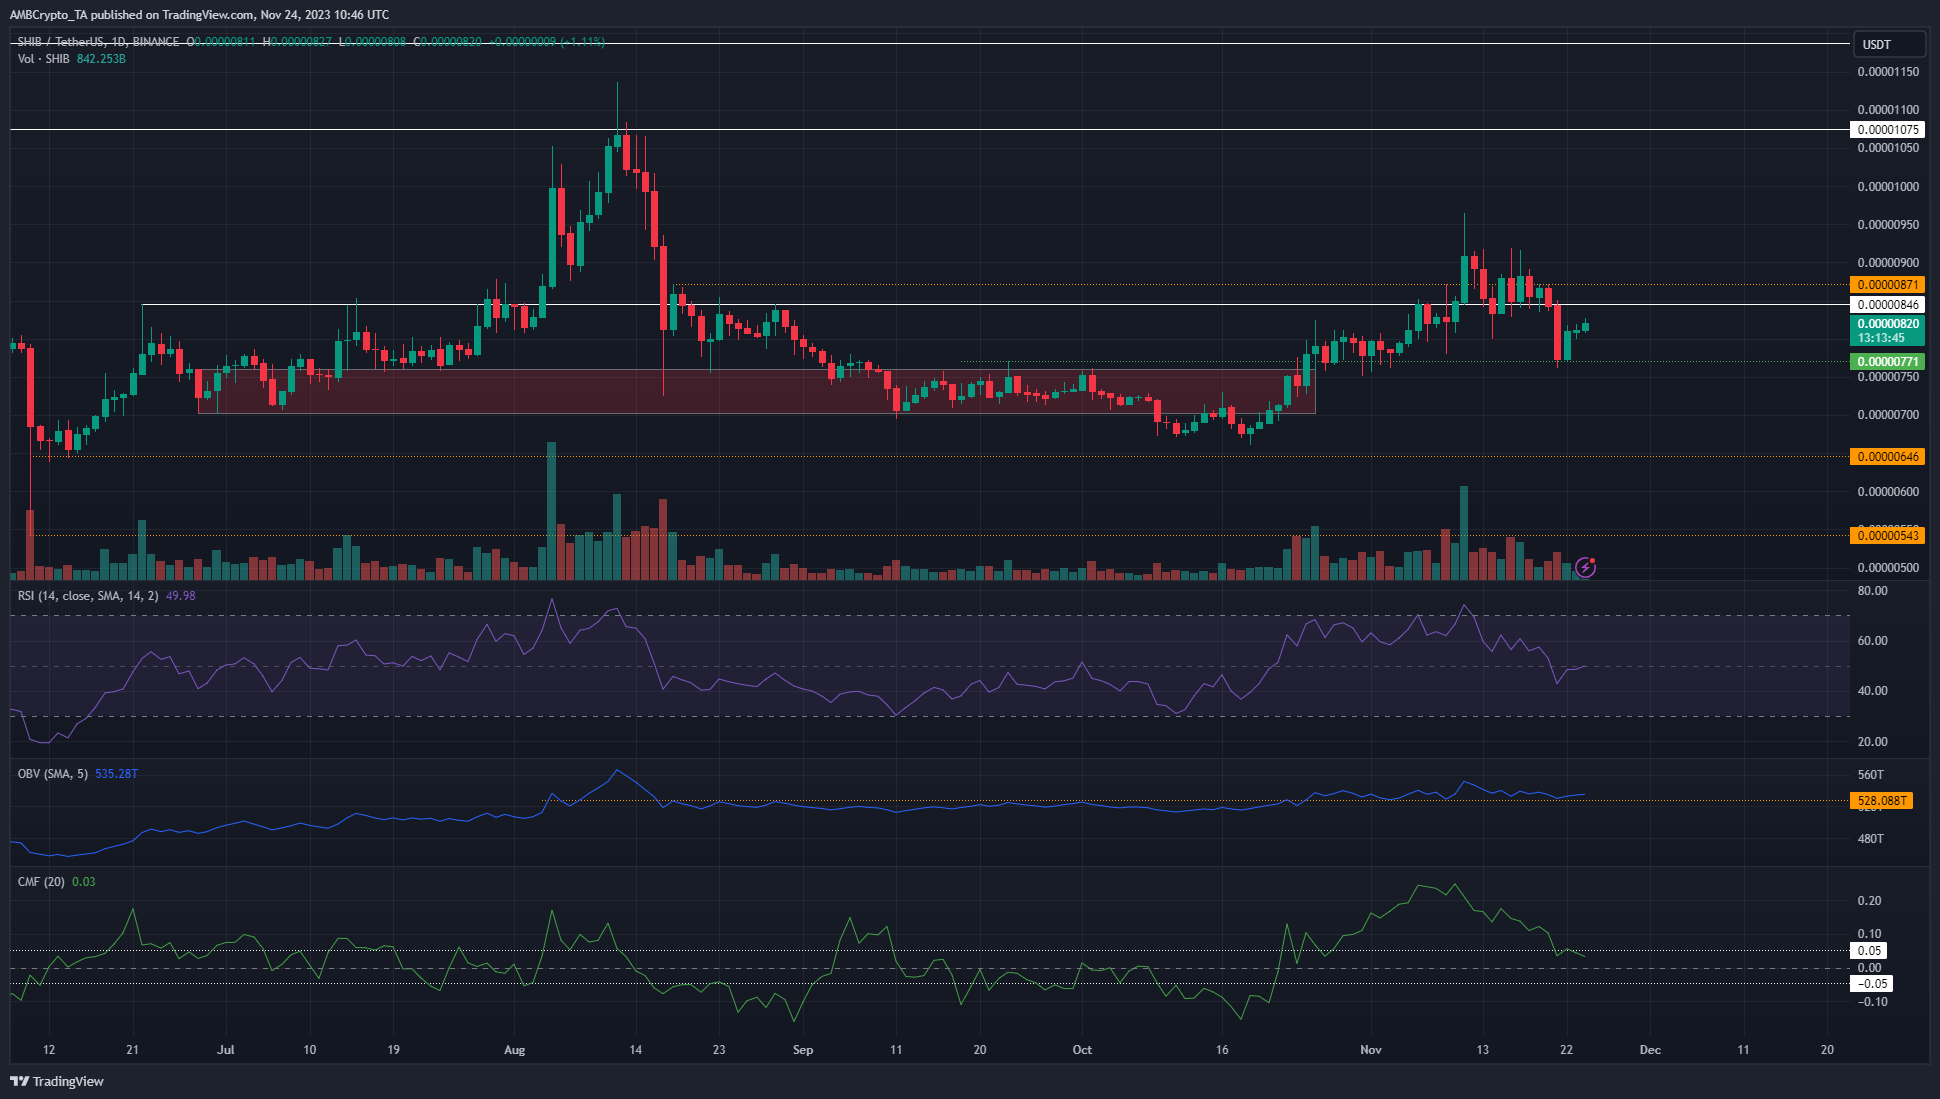
Shiba Inu [SHIB] saw its technical indicators shift bearishly on the one-day chart. The meme coin saw a 21% dip from the local high of $0.00000965 to $0.0000076 on 21st November. However, despite the large pullback, a move higher could commence.
SHIB’s performance was relatively lackluster in the past month compared to Dogecoin [DOGE]. The interest in the Shibarium ecosystem also appeared to wane.
The weekly lower high was broken and saw a near-perfect retest
The one-day chart above showcased a bearish structure. The recent higher low set at $0.0000078 on 9th November was breached and SHIB sank to $0.0000076. Yet, despite this technical bearish bias, it was quite likely that SHIB could soon make close to 30% gains.
This was because the $0.0000077 level, marked in green, was the previous lower high on the weekly chart. It was broken in mid-October and retested as support in the past few days. Hence it was a strong signal of bullish intent on the higher timeframes.
The indicators on the daily did not agree with this. The RSI dipped below neutral 50 while the Chaikin Money Flow (CMF) also entered neutral territory. The On-Balance Volume (OBV) barely managed to hold on to a support level as well.
Sentiment and network activity showed bulls could gain some traction
Source: Santiment
The weighted sentiment metric saw a few large upward spikes in November but remained negative for the most part. This signaled social media engagement leaned bearishly.
Is your portfolio green? Check the SHIB Profit Calculator
The active addresses metric saw a spike on 22nd November that coincided with a large surge in age consumed.
This meant that the dip was accompanied by a flurry of activity on-chain that could also indicate a wave of selling. Whether it will be followed by a further dip in prices remains to be seen.


