Shiba Inu: Can a 936% hike in burn rate push SHIB’s price in 2025?

- SHIB has been unable to go back above its short-moving average.
- Its burn rate has dropped after its spike.
Shiba Inu [SHIB] has seen a dramatic spike in its burn rate, with data from Shibburn revealing a staggering 936.52% increase on the 23rd of December.
Over 6.69 million SHIB tokens were permanently removed from circulation during this period. Despite this monumental jump, SHIB’s price action has been less consistent, reflecting both gains and declines in the days following.
SHIB burn rate: A volatile metric
On 23 December, the SHIB burn rate spiked significantly, aligning with heightened network activity. However, while the burn rate for that day reached an impressive 936.52%, the seven-day burn rate was still in negative territory at -59.79%.
As of this writing, the burn rate has cooled off to -15.83%, with the seven-day metric plunging further to -77.06%.
Such fluctuations highlight the volatile nature of token burns as a metric for evaluating Shiba Inu’s supply reduction efforts.
While significant one-day spikes can indicate increased activity, consistent weekly declines suggest that the burning mechanism has yet to gain sustained momentum.
A mixed reaction to the SHIB burn
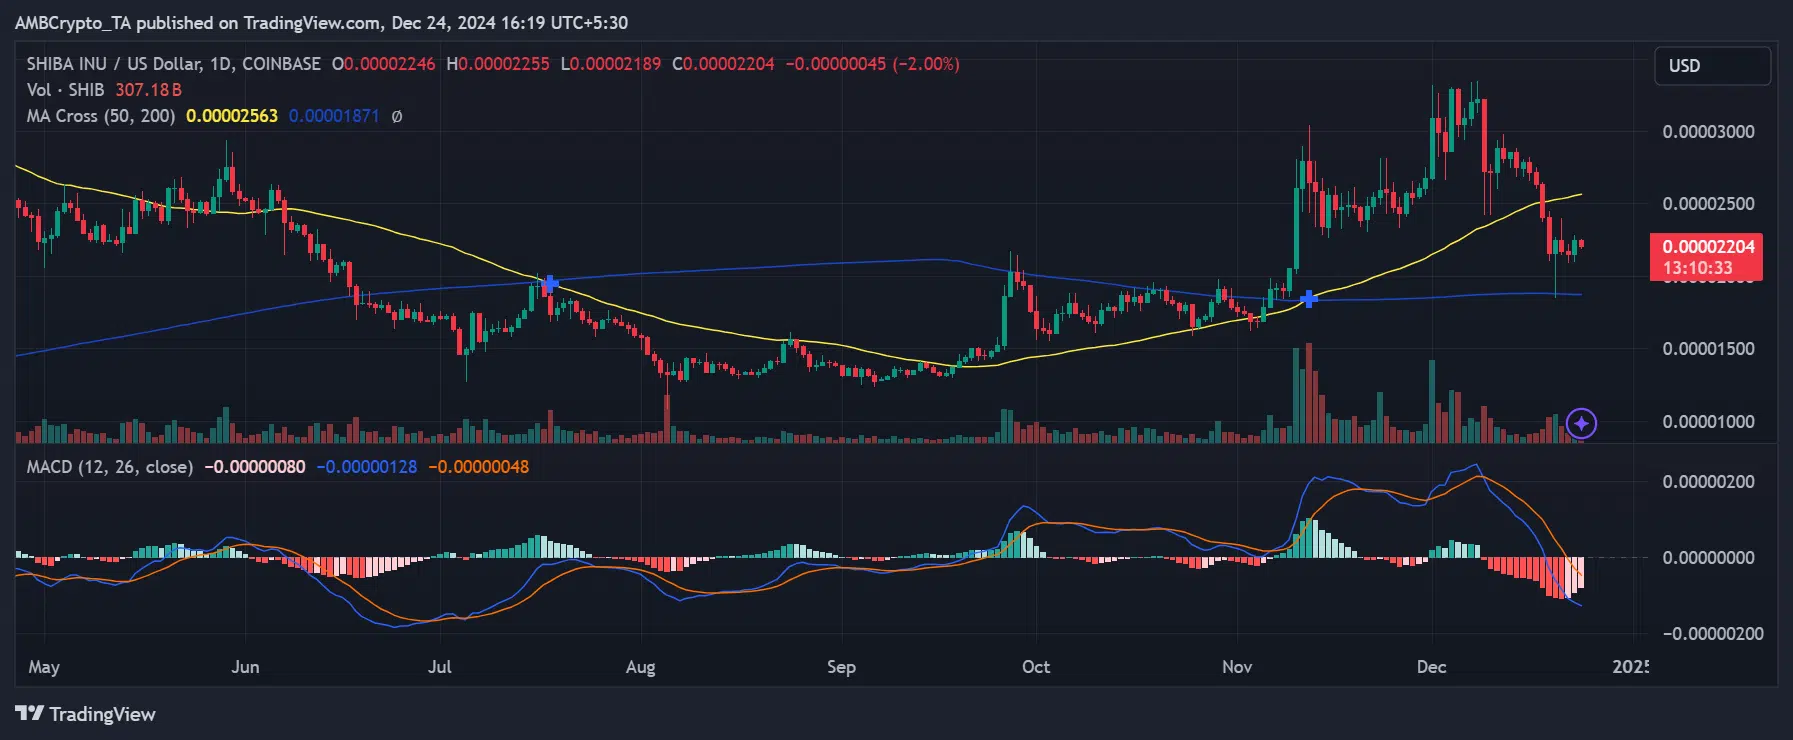
Despite the burn rate spike, SHIB’s price response has been less predictable. On the 23rd of December, SHIB saw a 4% price increase, hinting at a potential market reaction to the news. However, as of this writing, SHIB is trading at $0.00002204, reflecting a 2% decline in the current session.
The chart reveals several important technical trends. The 50-day Moving Average (MA) (yellow line) is trending above the 200-day MA (blue line), signaling a bullish crossover that typically indicates long-term upward momentum.
Meanwhile, the MACD histogram has dipped into the red, suggesting waning bullish momentum. The MACD line crossing below the signal line indicates potential bearish pressure in the short term.
Trading volumes remain significant, reflecting heightened activity around SHIB. However, recent sessions have shown a decline, possibly due to market participants awaiting clearer signals.
What’s next for SHIB?
The dramatic surge in SHIB’s burn rate and the price fluctuations highlight the effects that could sometimes be seen. While burning tokens theoretically reduces supply and could increase value, the effect remains subdued without consistent market demand.
The MACD signals suggest caution for short-term traders, as bearish momentum could lower prices. However, the bullish crossover in the MA provides hope for long-term investors, indicating potential upward momentum if SHIB sustains its support levels.
– Realistic or not, here’s SHIB market cap in BTC’s terms
The Shiba Inu burn mechanism remains a focal point for the community, with its dramatic spikes drawing attention to supply reduction efforts. However, SHIB’s price remains heavily influenced by broader market sentiment and trading activity.


