Bitcoin Dominance rose to 63.7% and Bitcoin was trading at $13,501 at press time. The altcoin market saw losses, with giants such as Ethereum also registering losses as it closed beneath $400. This could be explained by interest shifting from altcoins to Bitcoin, causing sell pressure on altcoins and buy pressure on BTC. Polkadot and Tron saw heavy losses in recent days, and the exchange token FTT was not exempt from selling pressure as well.
Polkadot [DOT]
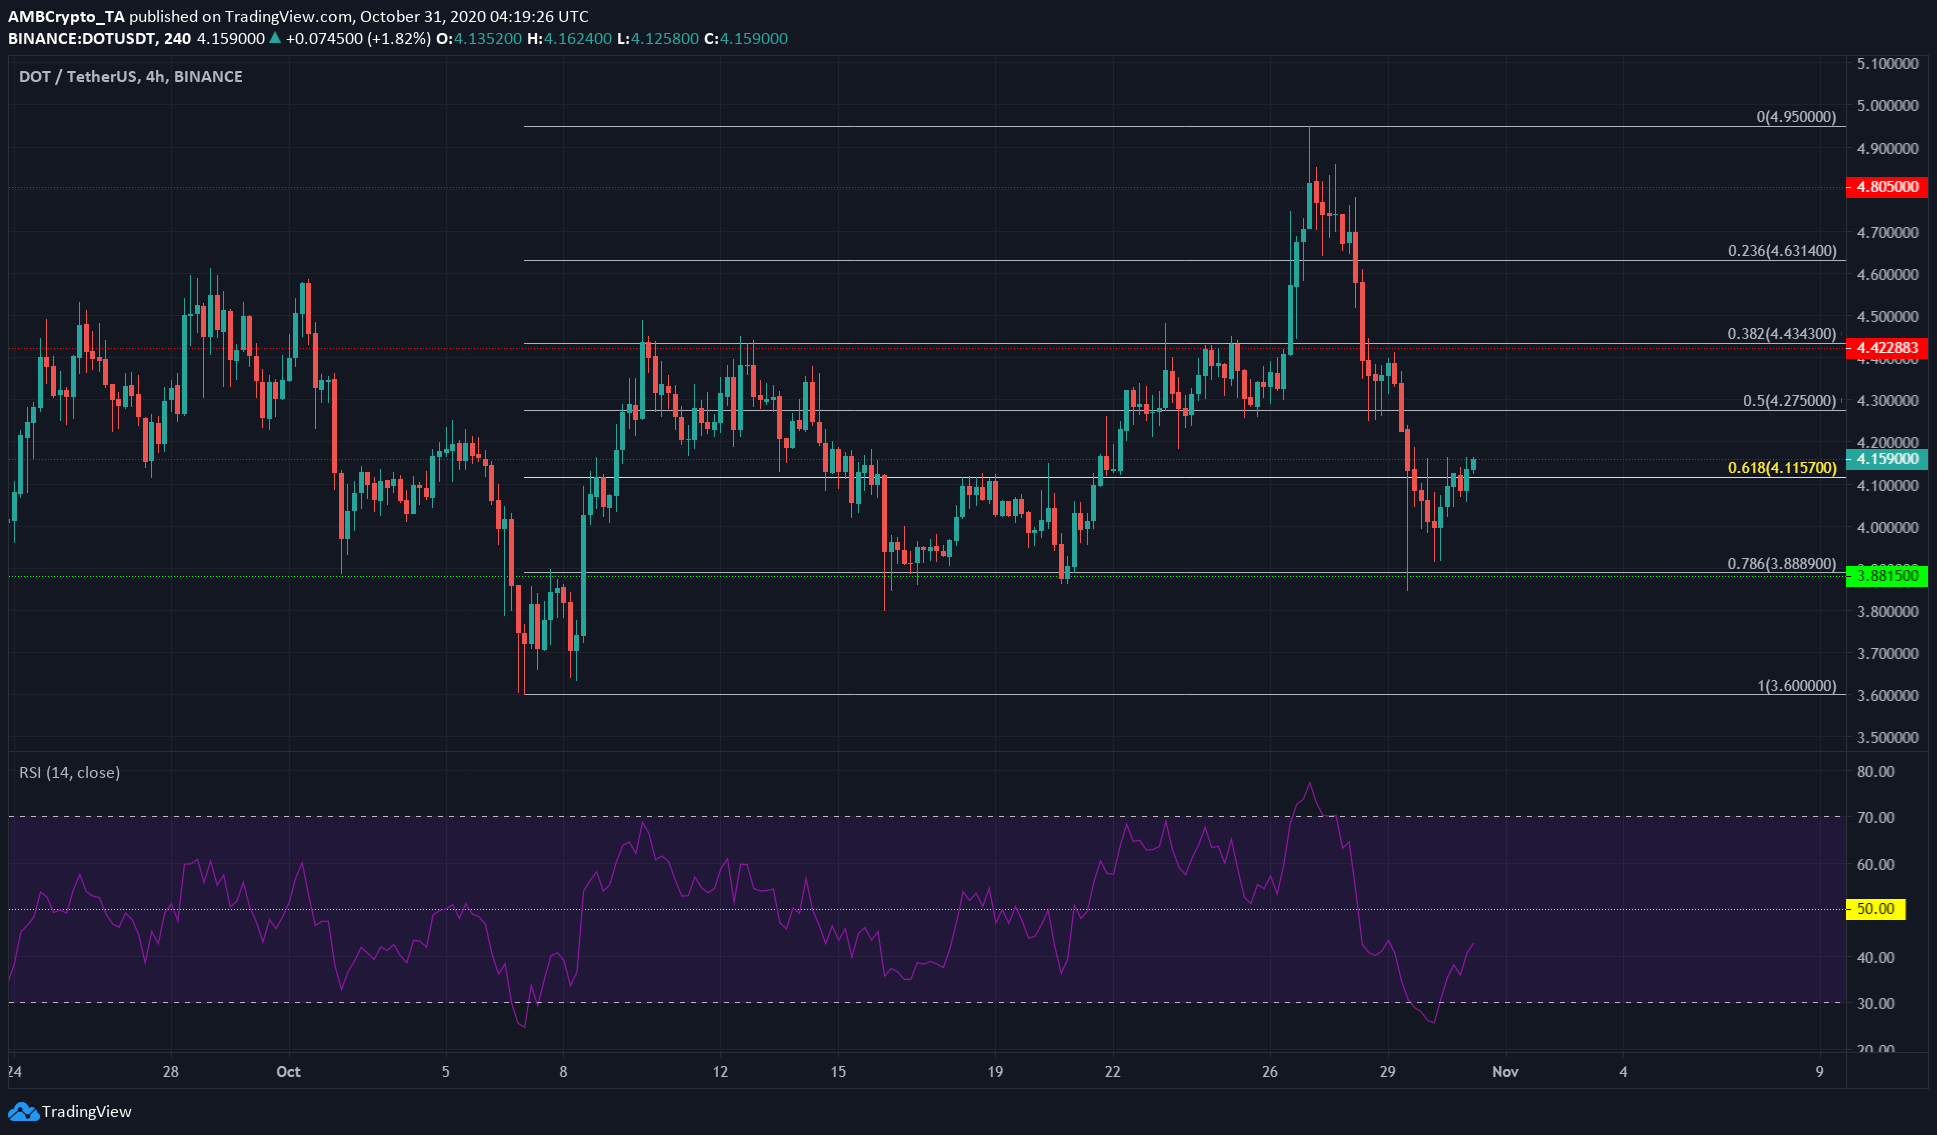
Source: DOT/USDT on TradingView
The Fibonacci Retracement tool was used on the move from $3.6 to $4.95 for DOT and highlighted some important levels of retracement that could act as support or resistance.
At the time of writing, DOT was trading just past the 61.8% retracement level of $4.11, underneath resistance at $4.17.
Th RSI was in the oversold region and recovered in the past few sessions, but the momentum still remained bearish. Hence, DOT can reach as high as $4.27 on a relief rally, before facing another drop.
Tron [TRX]
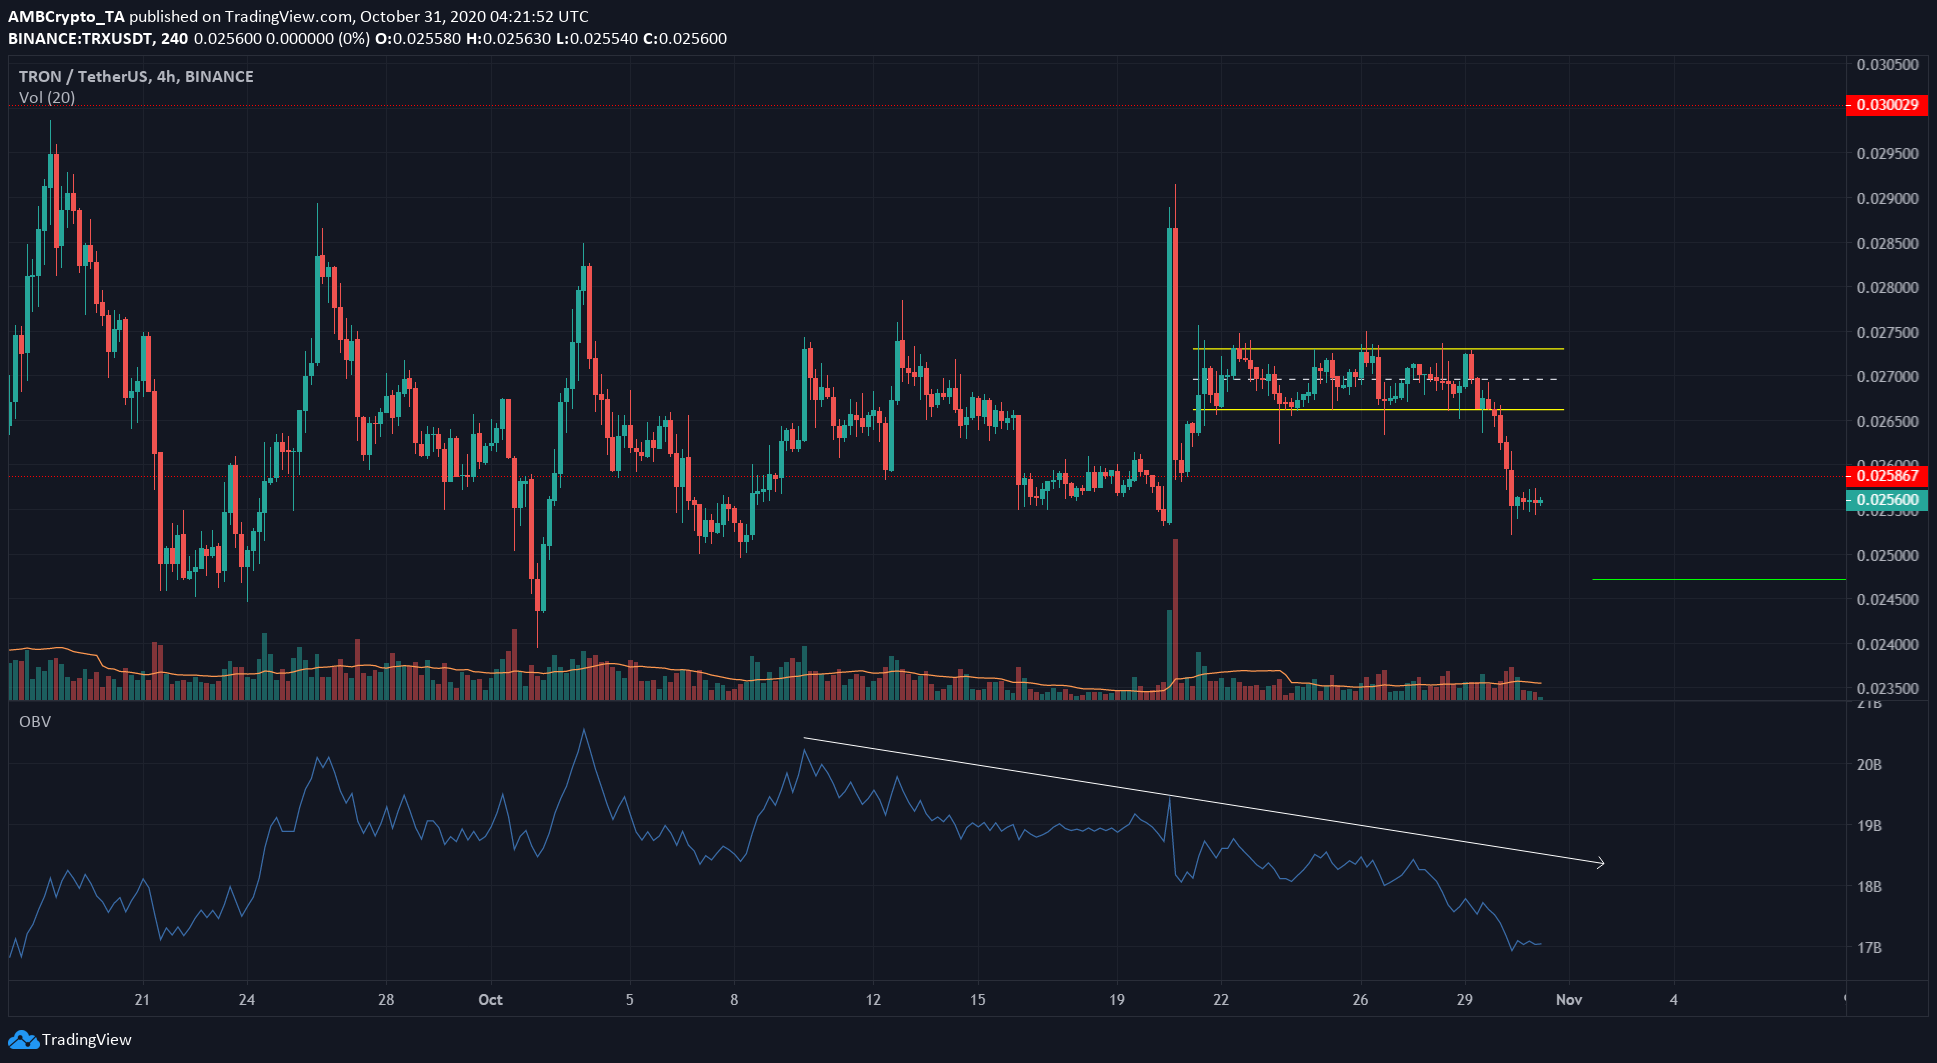
Source: TRX/USDT on TradingView
Tron was trading within a rectangle pattern that could have broken out in either direction. The market scenario forced the price lower, and a loss of nearly 5% was registered within hours.
The level at $0.247 can offer some support if TRX dropped further. The next level of support for TRX lies at $0.226. A retest of flipped level $0.258 could be a good entry for a short position.
The OBV showed that selling volume has outweighed the buying volume in the past few weeks, and the downtrend could be set to continue in both price and buying volume.
FTX Token [FTT]
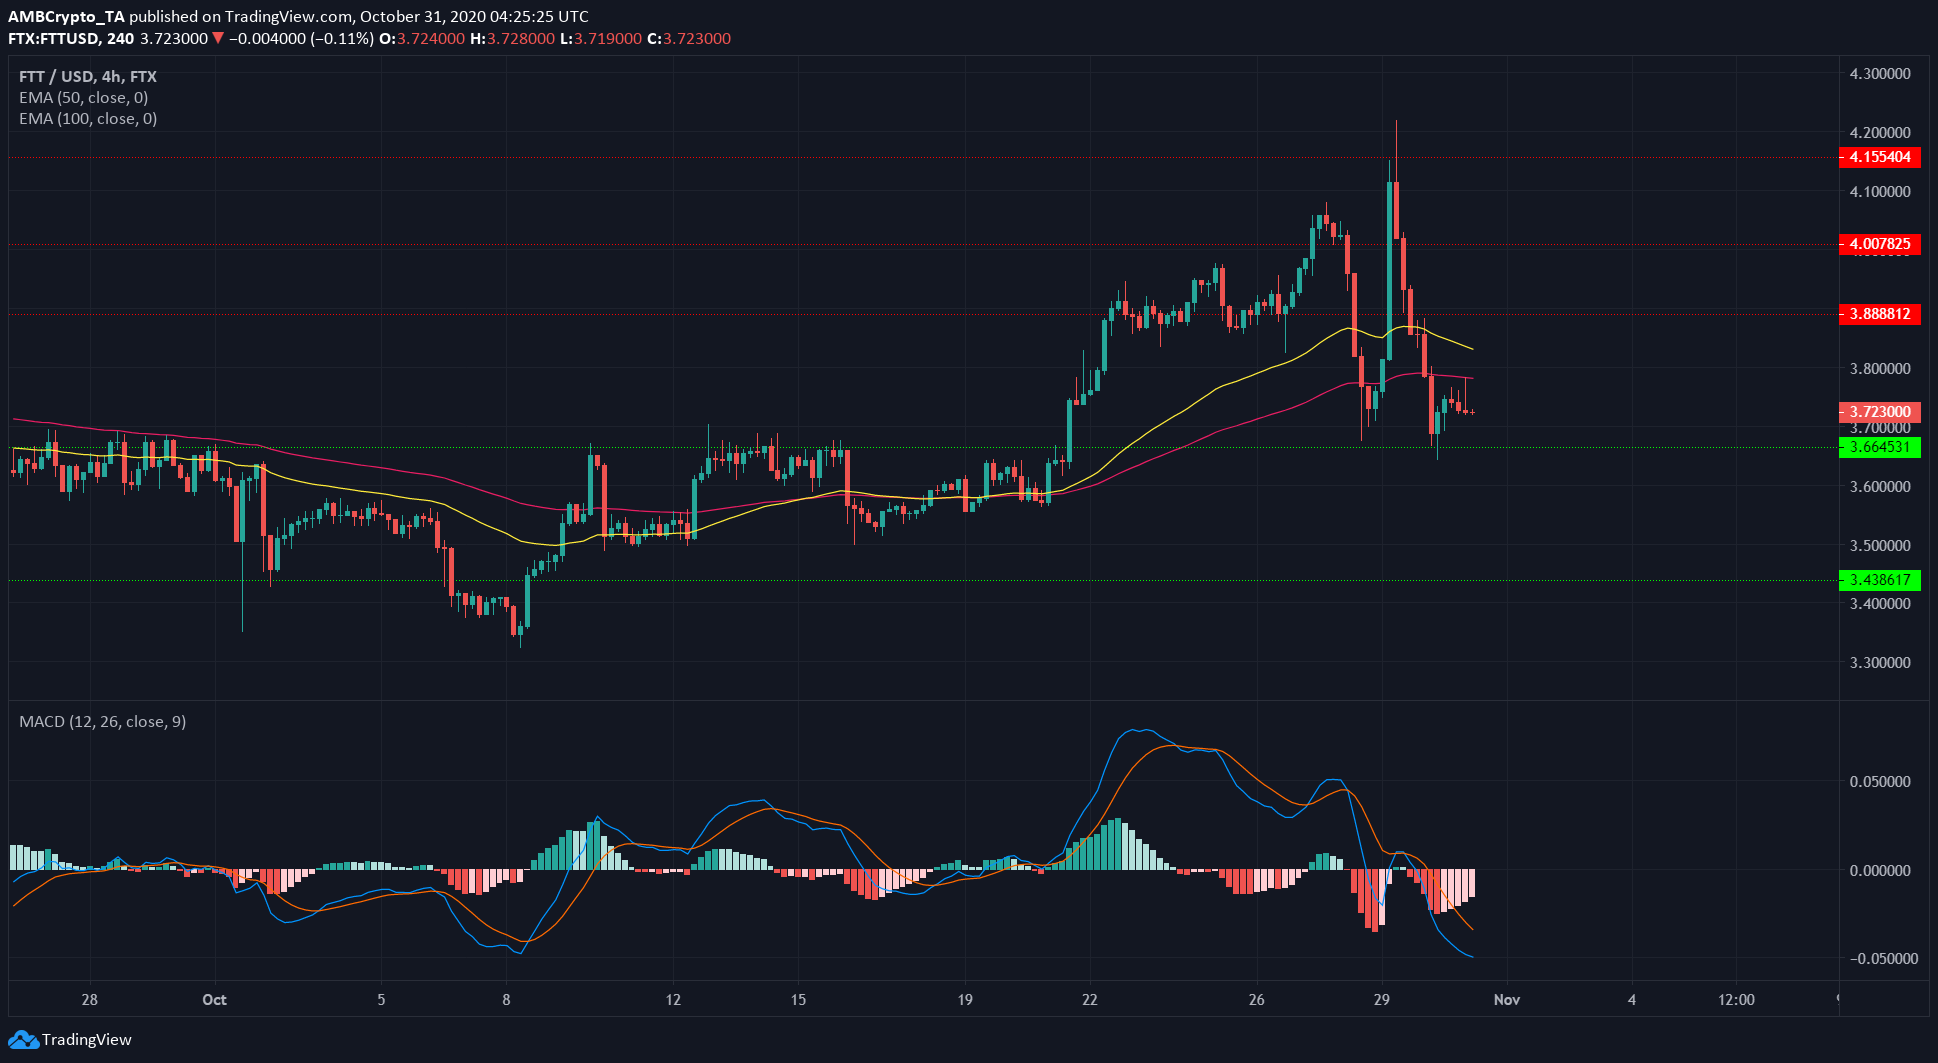
Source: FTT/USD on TradingView
FTT saw strong bearish momentum in recent days. The MACD has signaled a sell signal in the past week, and a few days ago also moved beneath the zero line, indicating stronger bearishness.
The moving averages also highlighted the recent trend. FTT rose from $3.6 to spike to $4.2 but almost immediately was subject to intense selling pressure.
FTT was trading beneath its 100 EMA (pink) and could be set to drop lower, with levels of support at $3.66 and $3.43.