Analysis
Polkadot, Monero, Dogecoin Price Analysis: 2 October

The altcoin market has seen its fair share of ups and downs in the past week. In the past 24-hours Bitcoin’s price fell by over 3 percent and its impact has spilled over into the price action of coins like Polkadot and Monero which registered up to a 14 percent drop in the past day’s time.

At press time Bitcoin was being traded at $10,474 with a 24-hour trading volume of $225.1 billion.
Polkadot [DOT]

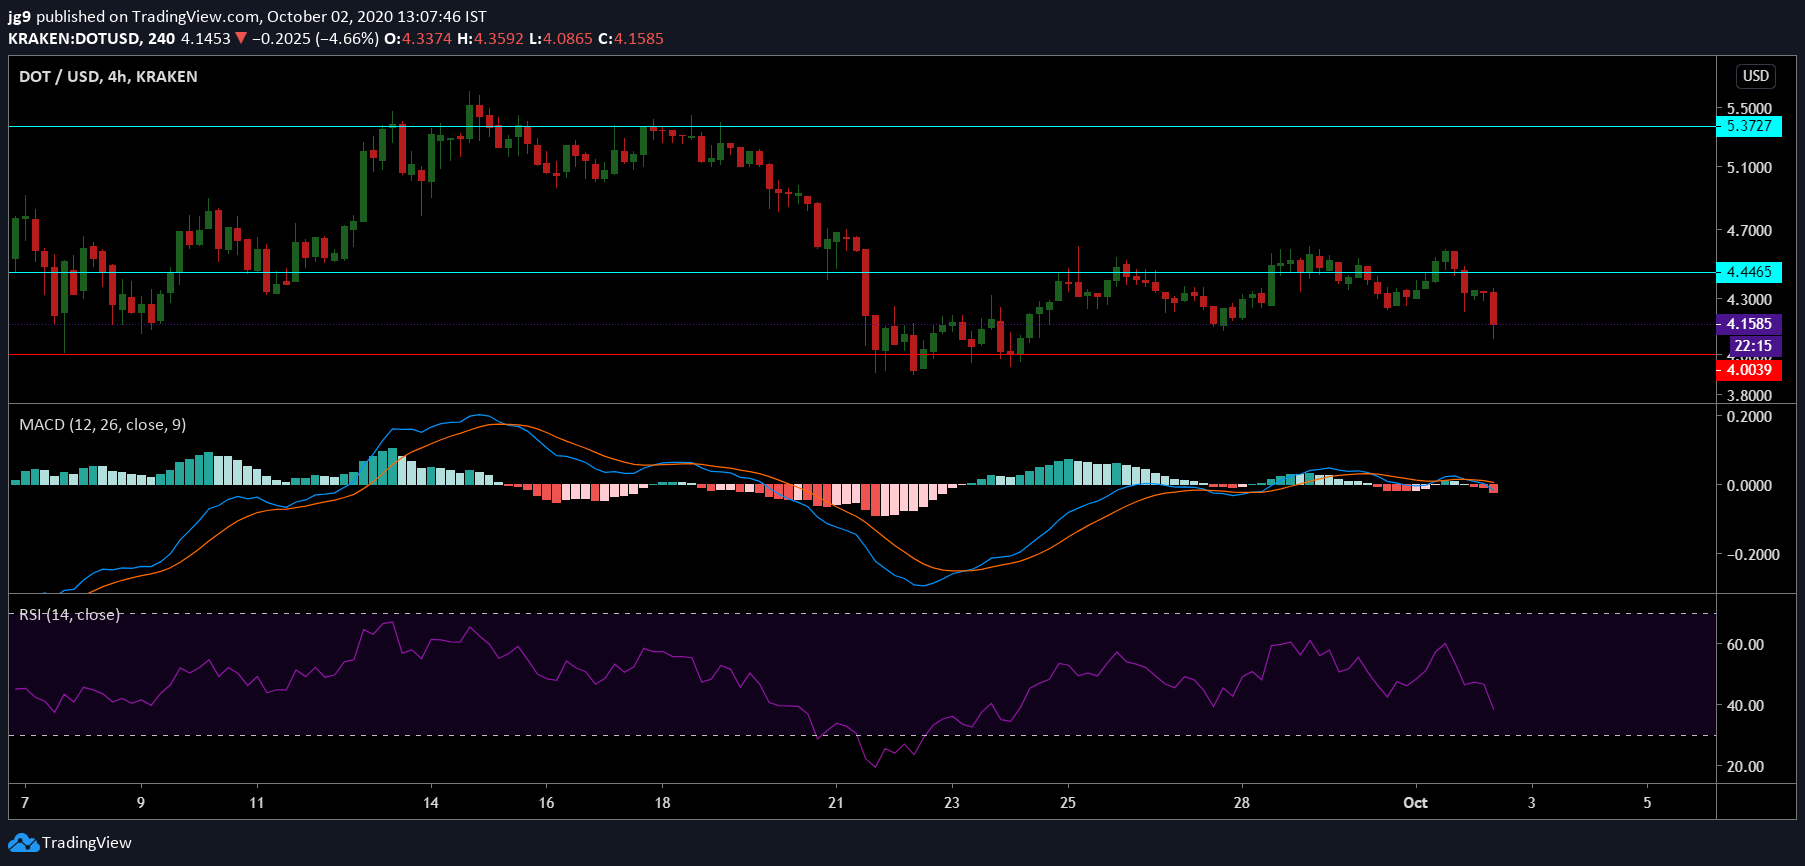
Source: DOT/USD, TradingView
Polkadot occupies 7th spot on CoinMarketCap’s list with a market cap of $3.5 billion and was being traded at $4.17 at press time. During the course of the past 24-hours, the coin lost over 5 percent and is now quite close to its support at $4. For a substantial time period as September came to a close the coin’s price has been trading between the mentioned support and resistance at $4.4. There is also considerable resistance for the coin at its early – September price range at $5.3.
Taking into account the MACD indicator a further dip in price can be expected as it has undergone a bearish crossover. The RSI echoes a similar sentiment as it has now plunged into the oversold territory.
Monero [XMR]
Source: XMR/USD, TradingView
Monero saw its price fall by close to percent in a day’s time and is now being traded at $99.4. Monero currently has a market cap of $1.7 billion and registered a 24-hour trading volume of $1.1 billion. In the past 24-hours, Monero’s price fell by over 14 percent. At press time Monero’s trading price is very close to testing the support at $94. The resistance level at $114 continues to remain strong.
The EMA ribbons have now settled by the current trading price and are offering support, however, the possibility of its support flipping to a resistance cannot be discounted. The MACD indicator has undergone a bearish crossover and indicates a further price decline.
Dogecoin [DOGE]
Source: DOGE/USD, TradingView
Dogecoin is currently being traded at $0.0026 and has a market cap of $324 million. In the past 24-hours, the coins price fell by close to 9 percent as it predominantly traded between the resistance level at $0.0027 and $0.0025 all throughout the past week.
The RSI indicator for the coin continues to remain by the neutral zone but is now heading towards the oversold zone. The Bollinger Bands are now slightly widening and signals a slight increase in volatility for the coin’s price.

