Ethereum
More uptrend for Ethereum? Here’s what’s possible…
- Ethereum continues to trade close to the $1,800 price range
- Different metrics have flashed positive and warning signals
Two common questions associated with Ethereum are whether it will continue its upward trend or when a price correction might occur. Recent reports indicating the behaviour of key metrics may provide insights, potentially revealing the answers within the charts.
Read Ethereum (ETH) Price Prediction 2023-24
Ethereum supply on exchanges declines as…
At the time of this report, Ethereum was trading with a minor loss of less than 1%. Notably, despite this slight dip, it remained above the $1,700-mark, hovering closely to the $1,800 price range. Furthermore, the consistent uptrends in Ethereum’s price have coincided with a decreasing supply of ETH on exchanges.
As reported by Santiment, the decline in ETH supply on exchanges became apparent around October 23rd. Interestingly, this decrease aligned with the day ETH experienced its most significant surge in the recent bullish trend.
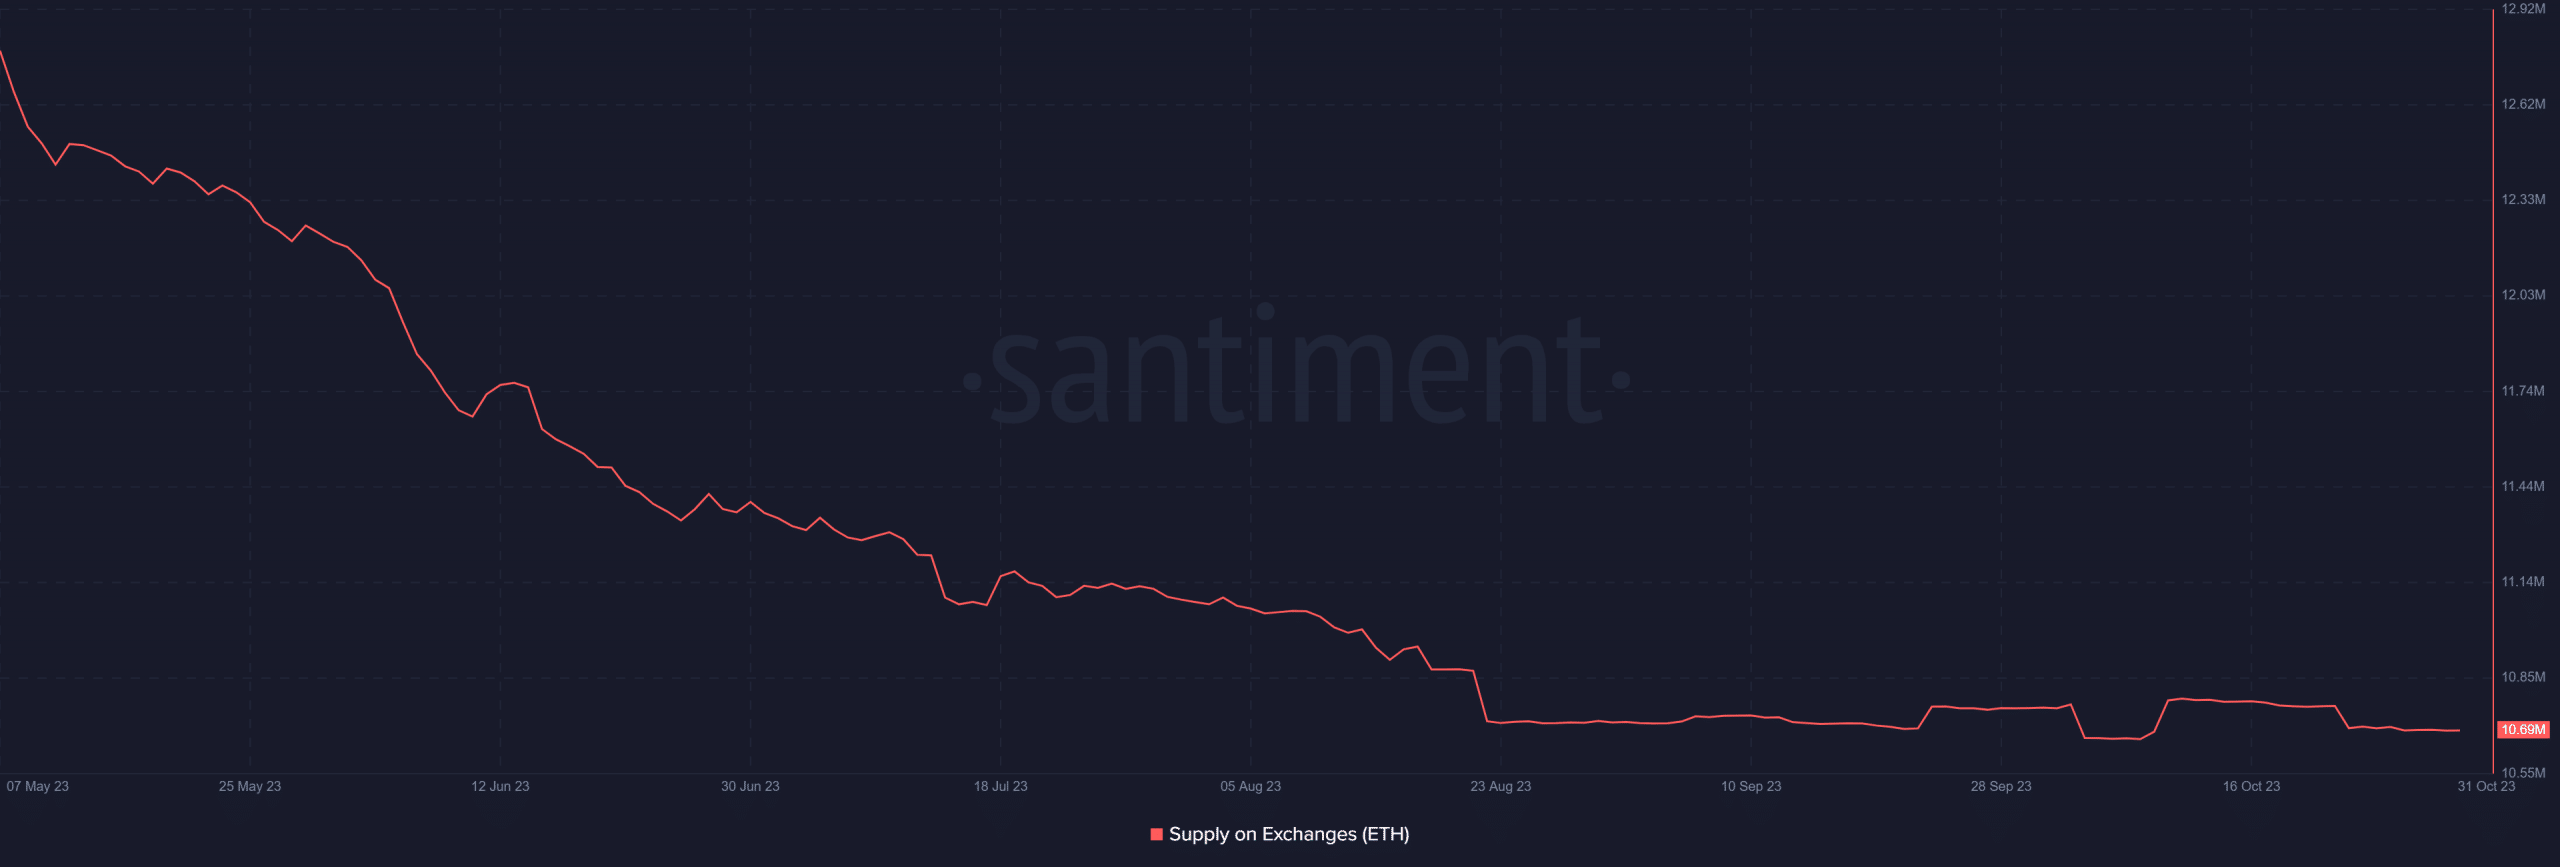
Source: Santiment
Also, this drop in supply suggested that investors’ confidence had grown, and they were more inclined to purchase and hold Ethereum. Additionally, a further drop in supply could create scarcity and drive up demand. Right now, the supply of ETH on exchanges stands at approximately 10.7 million ETH.
USDT market cap growth shows liquidity
Another positive metric indicating a sustained uptrend is the market capitalization of USDT (Tether) in the Ethereum ecosystem. The chart revealed that the USDT market cap has been expanding alongside the rising price of ETH. This increase in USDT’s market cap signified that more liquidity has been entering the market.
The continuous influx of liquidity is expected to bolster price growth and maintain the ongoing bullish trend.
Ethereum’s social dominance and volume wane
As Ethereum’s price began its ascent, there was a noticeable correlation with its trading volume, evident in the volume chart. According to Santiment, the chart displayed a remarkable spike, surging to over $19 billion during the period of upward price movement. This surge represented the highest trading volume seen in the last five months.
However, in more recent times, the volume trend has revealed a decline. At the time of this report, the trading volume had fallen to approximately $7.4 billion. The drop in volume signified a reduction in momentum and a gradual loss of interest from traders.
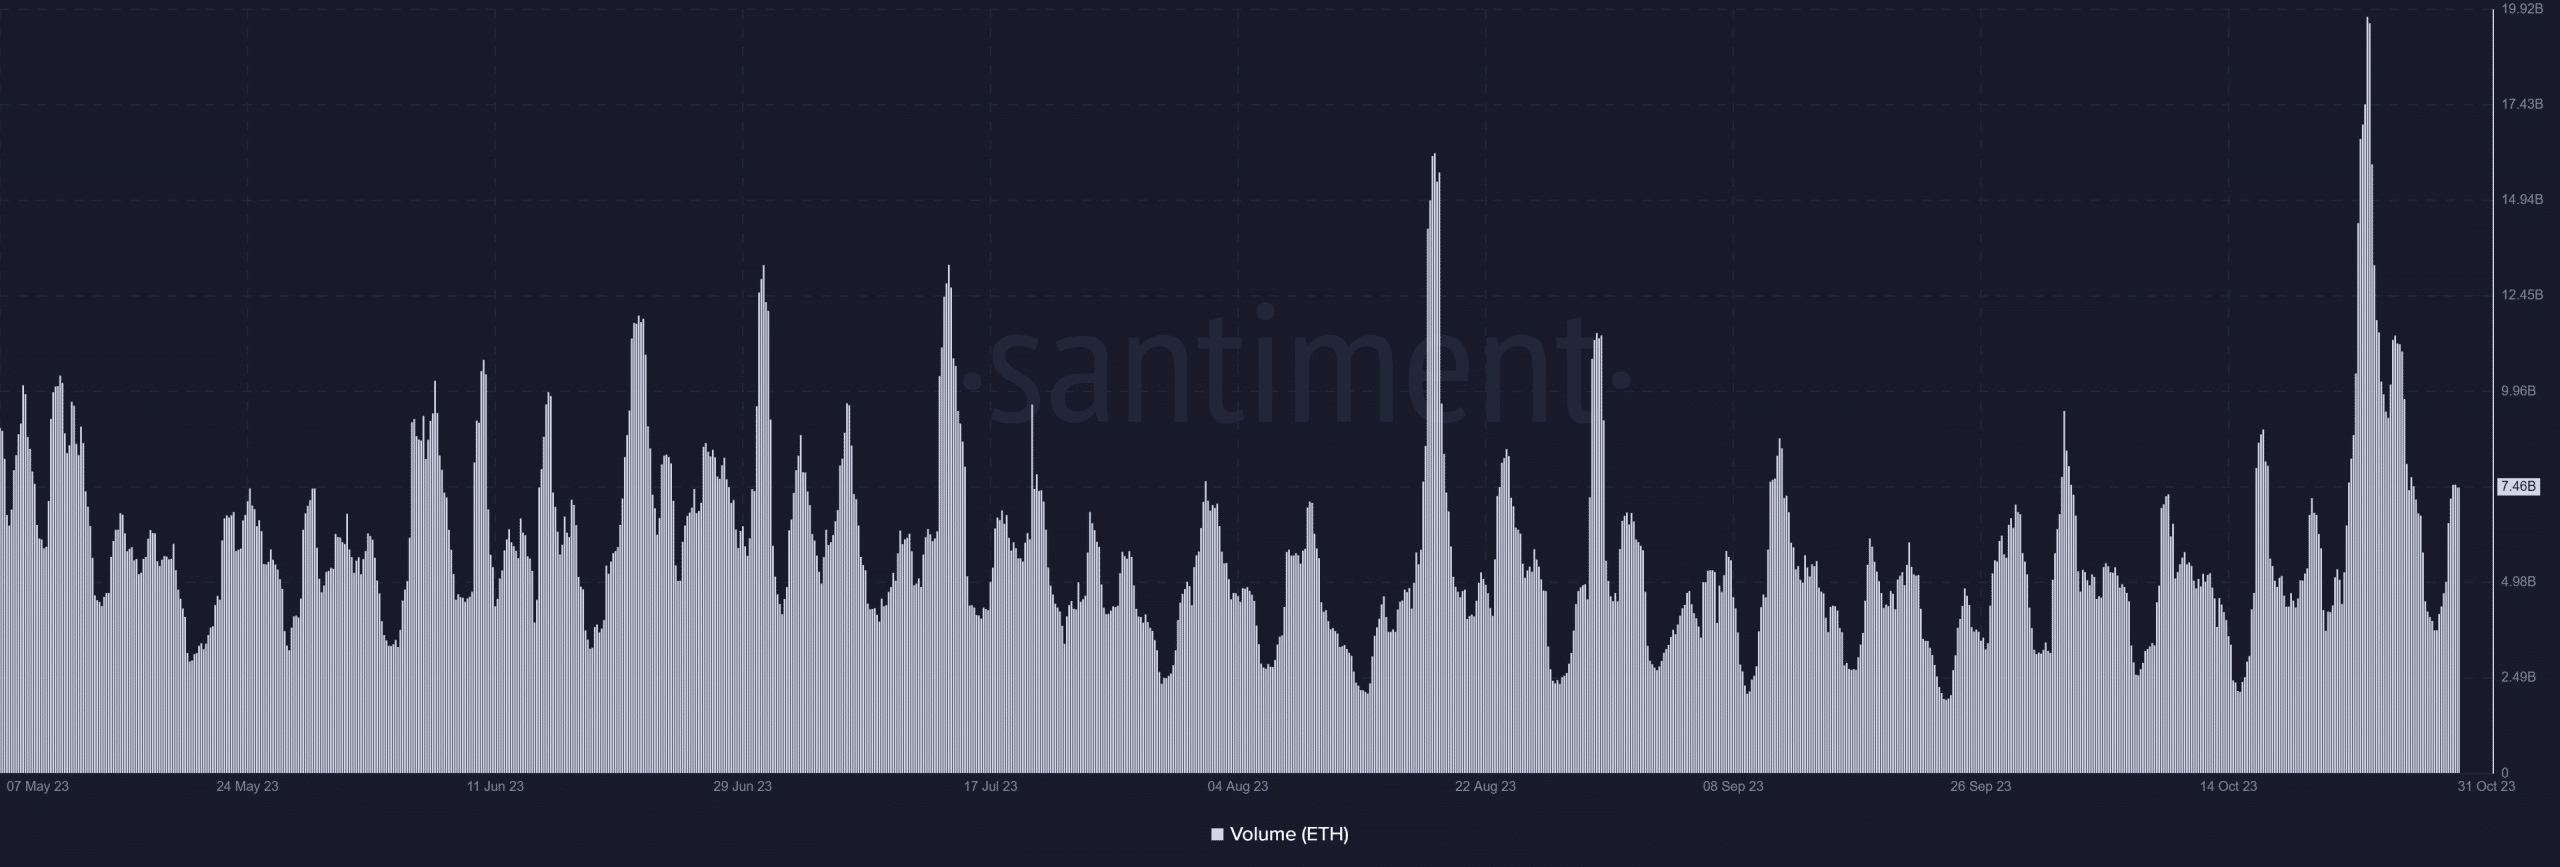
Source: Santiment
Furthermore, Ethereum was seeing a gradual decline in its social dominance, as indicated by the corresponding chart. The data revealed that ETH’s social dominance had dropped to around 7.2% at the time of this report.
This decline in the social dominance metric is a sign that discussions and conversations surrounding Ethereum are gradually waning. It also implies a diminishing level of interest in the cryptocurrency – A negative signal.

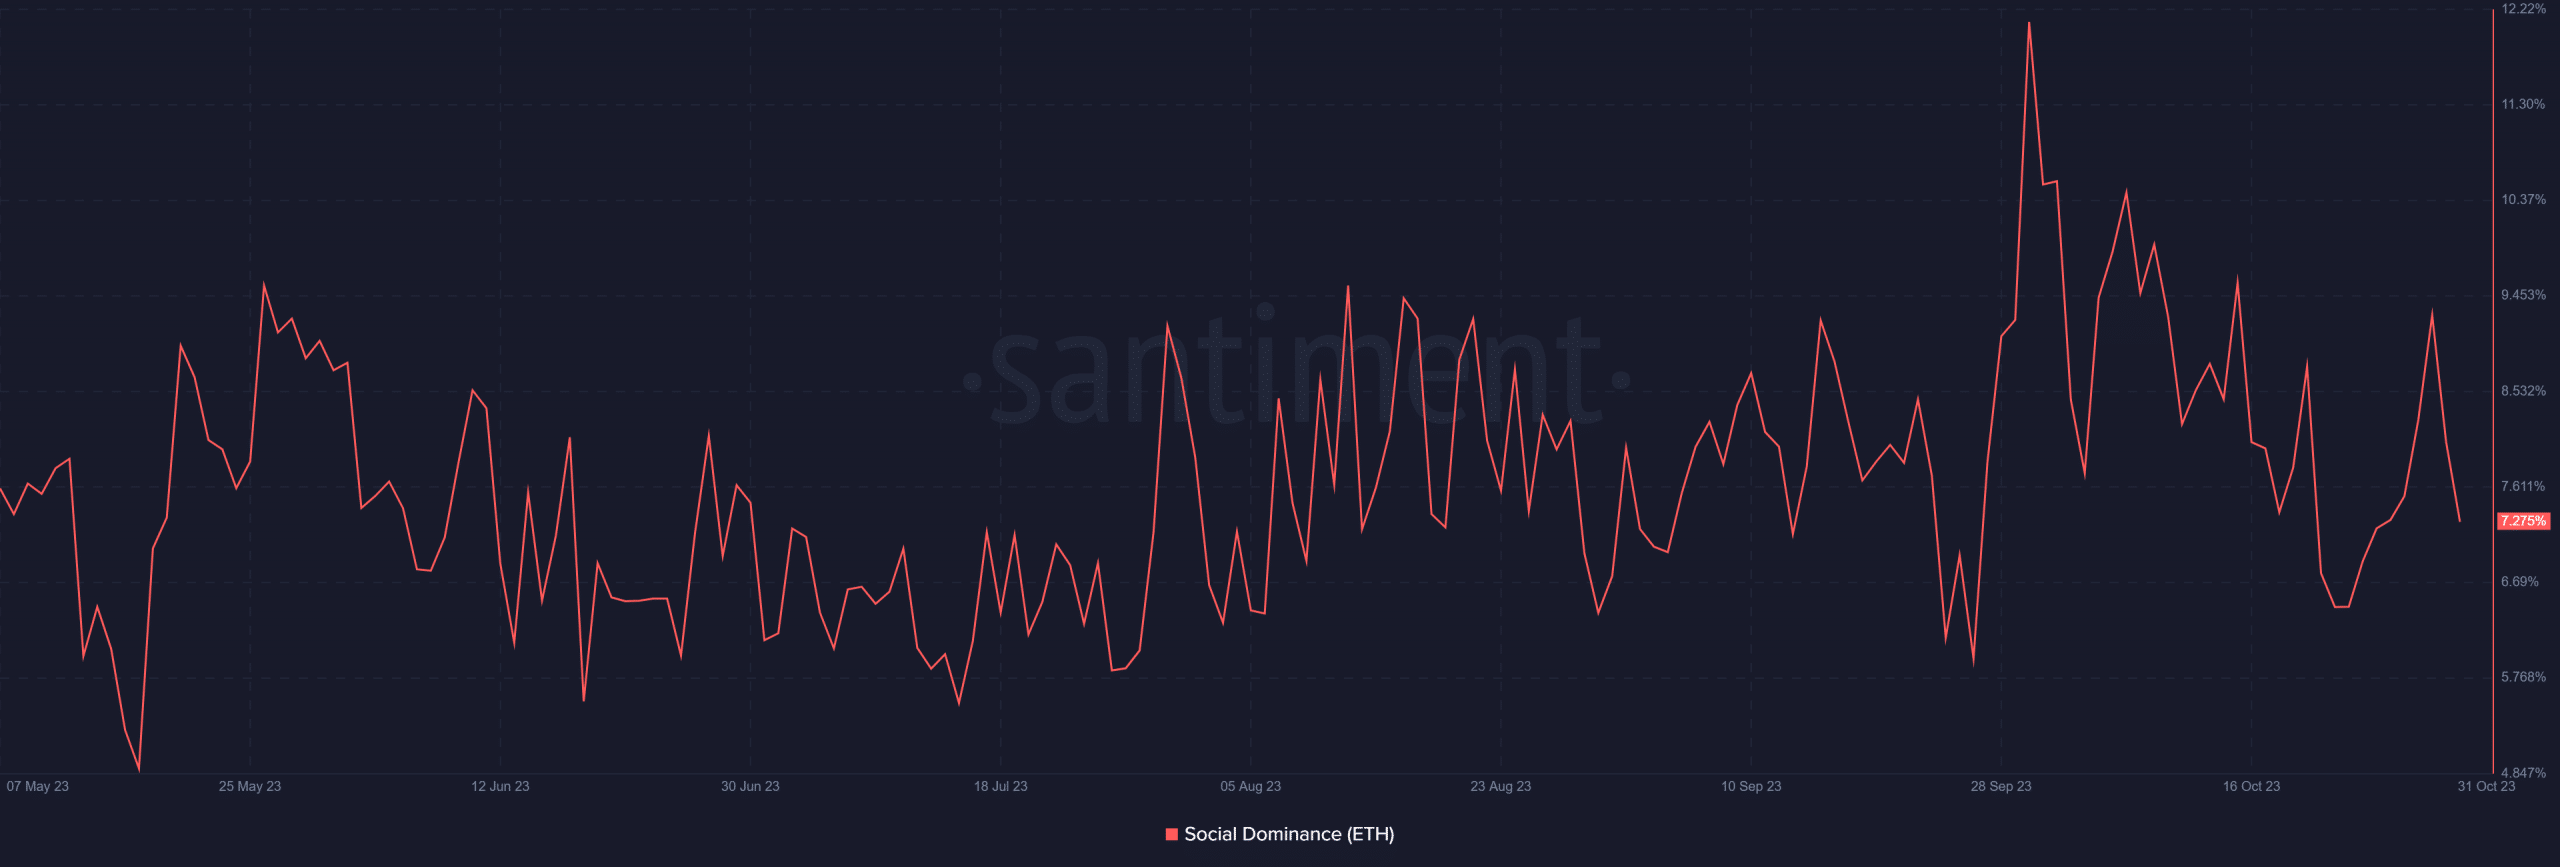
Source: Santiment
Price could go either way
The aforementioned metrics collectively indicate that Ethereum’s ongoing uptrend, or a potential reversal, is contingent on a multitude of factors. Notably, the sentiment and behaviour of traders play a pivotal role. If momentum regains strength, with increased liquidity entering the market and traders persisting in their strategy of buying and holding, a price spike will be likely.
– Is your portfolio green? Check out the Ethereum Profit Calculator
Conversely, should the opposite scenario unfold, with reduced momentum and a fall in buying and holding sentiment, a price decline could be on the horizon.
Simply put, Ethereum’s future price movement is closely tied to the actions and sentiments of market participants.