Monero’s breach from falling wedge could trigger a rise

Monero, the privacy centered cryptocurrency has been struggling to make some ground as its price continued to move sideways ever since the massive fall on 24th September. The altcoin was trading at $54.34 at press time having lost 4.79% of its value in the last 24-hours. The total market cap of altcoin stood at $938 million.
1-Day Price Chart

Source: XMR/USD on TradingView
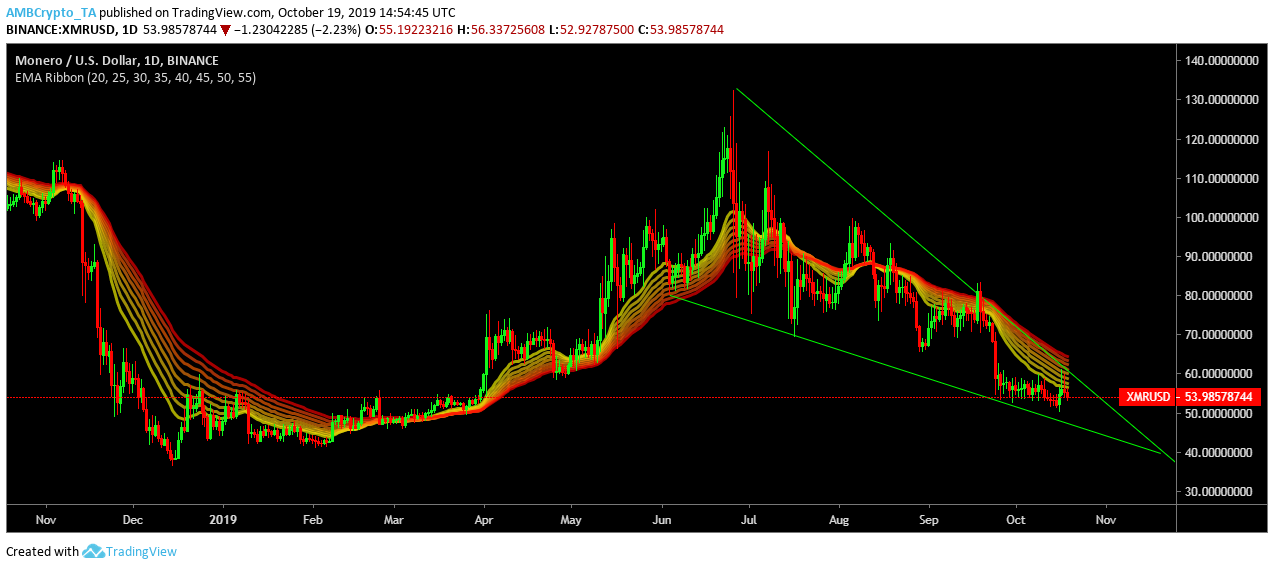
On the one-day price chart, Monero formed a falling wedge pattern, which is characterized by the formation of higher lows meeting the wedge at $132.26, $80.33 and $61.38. The lower lows met the falling wedge at $79.94, $69.79 and $52.25. The formation of the falling wedge is considered bullish as it is often followed by a breakout in an upward direction. The bullish breakout is expected to happen in 4-5 weeks.
Ema-ribbon suggested that the price volatility of the altcoin increased and the ribbon might act as a support for the prices in the coming weeks.

Source: XMR/USD on TradingView
MACD line has been moving above the signal line since the bullish crossover on 6th October, which indicated that the market sentiment was bullish.
Conclusion
Monero has been moving inside the falling wedge pattern since July, a breach from this would propel Monero’s price in green. The ema-ribbon indicated high volatility where the ribbons were in the transition period from acting as a resistance to moving toward forming support. MACD indicator suggested that the market sentiment was bullish. Thus, Monero looked bullish in the longterm.
