Analysis
Litecoin’s descending channel breach may lead coin down recovery path

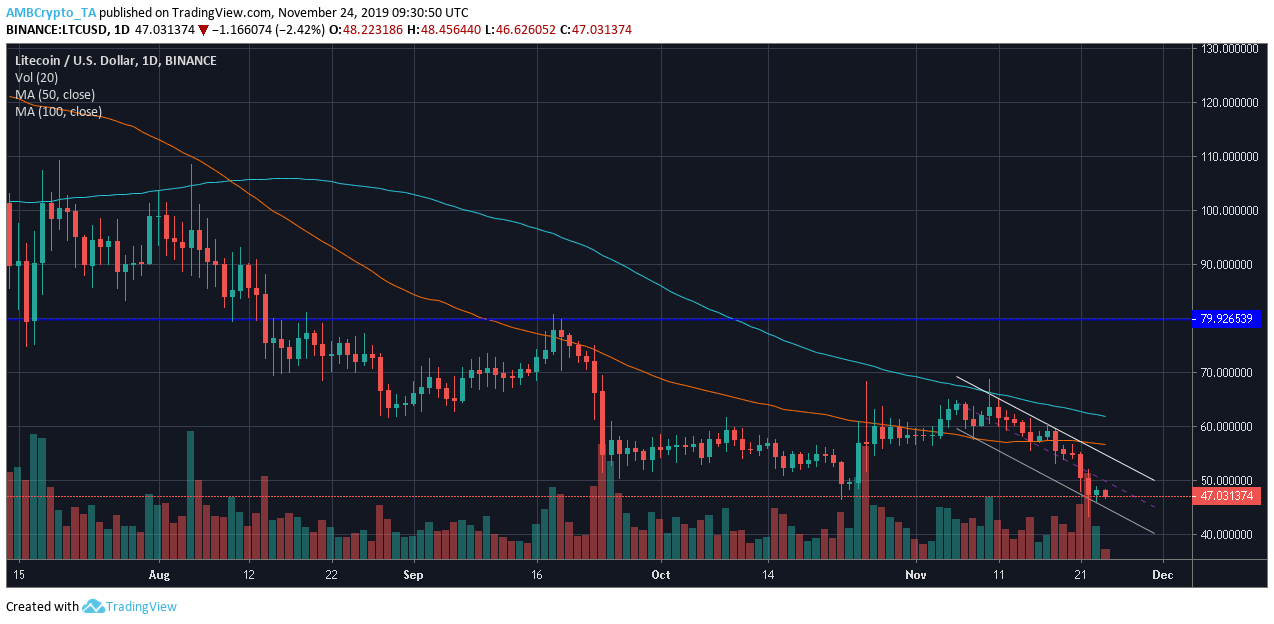
Litecoin’s descent started on 24 September, where it noted a free-fall by 35.85%. This fall resulted in the price of the coin to plunge from $79.92 to $51.27, following which it reported another drop of 19.62%. At press time, LTC was valued at $47.09 with a market cap of $3.02 billion and a trading volume of $2.5 billion.
The devaluation may likely end, as long-term charts reflected a bullish pattern making its way in the LTC market.
Daily

Source: LTC/USD on TradingView
The daily chart of LTC noted a descending channel extending across the falling price of the coin. The pattern, defined by two sloping trend lines, marked lower highs at $66.19, $62, and $59.36 and lower lows at $58.12, $47.87, and $45.86. The falling price was indicative of the bearishness in the market and the same was reflected with the moving averages.
50 moving average succumbed to the 100 moving average 105 days ago suggesting the bearish presence. With the averages aligning above the candlesticks a declining market was reported. However, with the breach of this descending channel, the price of LTC has been assumed to rise.
Source: LTC/USD on TradingView
The MACD indicator favored the bears, with the MACD line resting below the signal line. Even Relative Strength Index [RSI] reported an incredibly bearish market as the signal line dipped into the oversold zone and despite efforts to equalize the market, remained in the bearish end.
Conclusion
The Litecoin market notified an exceedingly bearish market, which can reverse with the breach of the descending channel. The breach may not result in a high surge in price but might set LTC on a recovery path.
