Crypto News

Litecoin could swing higher following the completion of ascending triangle pattern
Posted:

As the top altcoins entered into a brief moment of bullish frenzy, Litecoin exhibited 7.69% surge over the week and was valued at $74.73, at press time. The coin continued to trade below BCH and held a market cap of $4.72 billion. Additionally, Litecoin registered a 24-hour trading volume of $3.90 billion.
As predicted in a previous article, the coin underwent an upward breakout following the bull run.
Litecoin 1-day chart
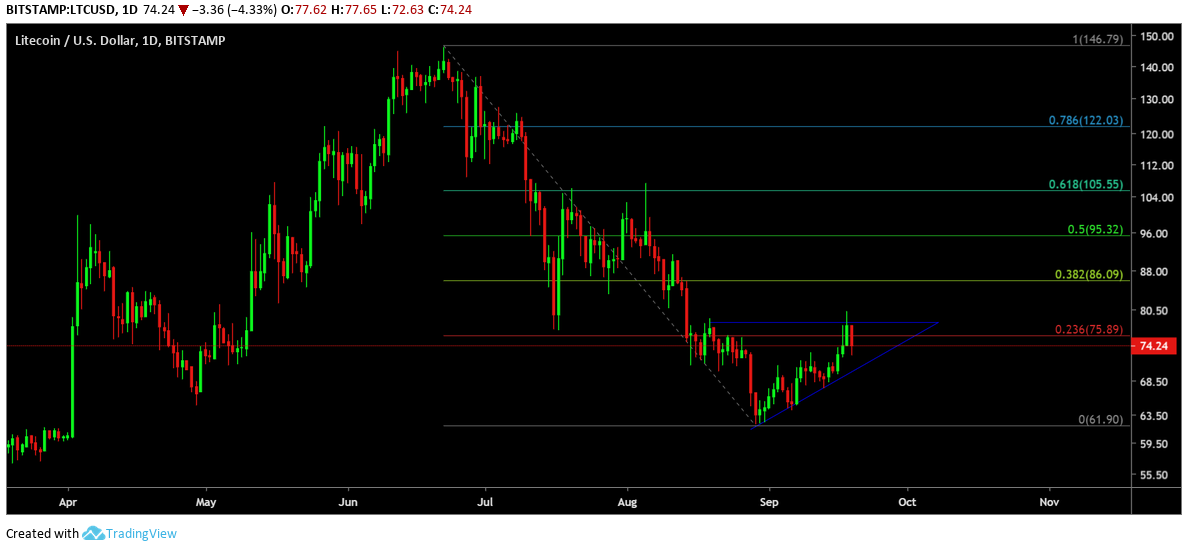
Source: TradingView
Litecoin had a brief tryst with the bulls after it hit a year high on 22nd June 2019. The silver crypto climbed to a price of $146.43. LTC remained within the Fib level of 146.79 and 0.786 for short period and dropped below key support of Fib level 0.236. And as the coin exhibited a fresh upward momentum along with its peer altcoins, one-day chart for Litecoin indicated an ascending triangle pattern.
This pattern suggested another bullish phase for the coin and potential price breakout on a positive side. MACD indicator in the chart below also edged toward a potential bull run with the reading line hovering above signal line.
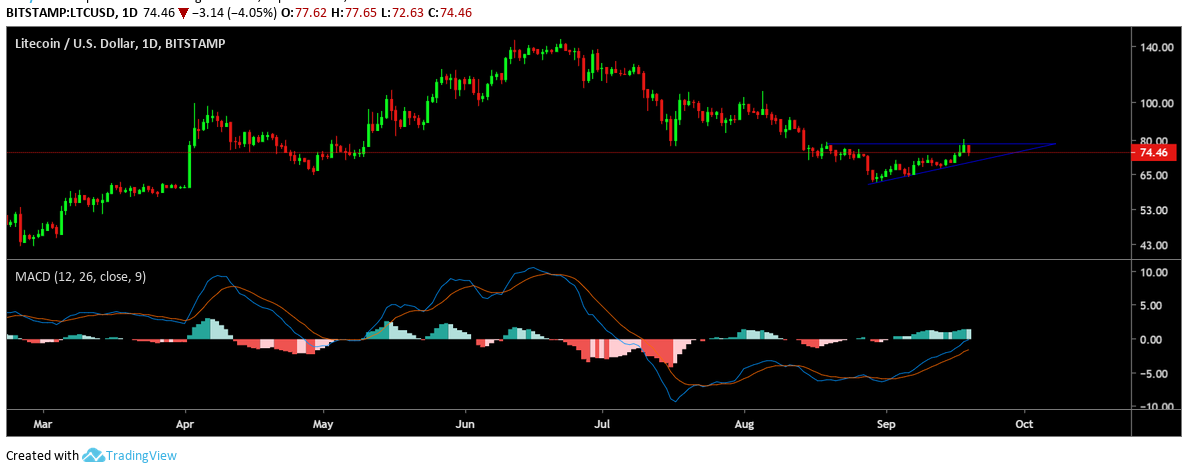
Source: TradingView
50-moving average line went below 100-moving average line around the same time when the coin underwent its second scheduled halving. After a brief stint with the bulls, LTC prices spiraled down shortly after the event and continued to hover below its key resistance levels.
According to the above daily chart, 50 moving average line continued to tread below the 100 moving average line.
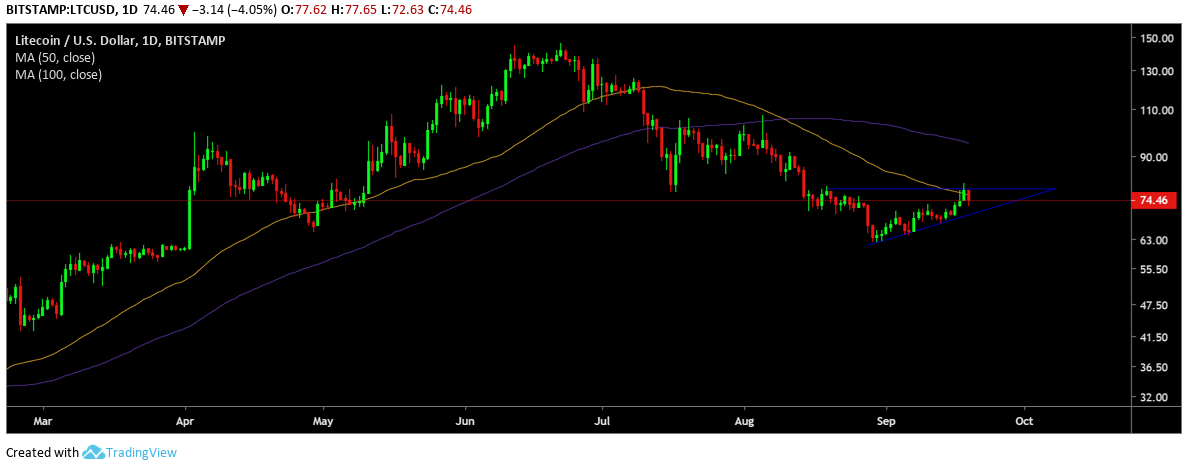
Source: TradingView
According to the above daily chart, 50 moving average line continued to tread below the 100 moving average line.
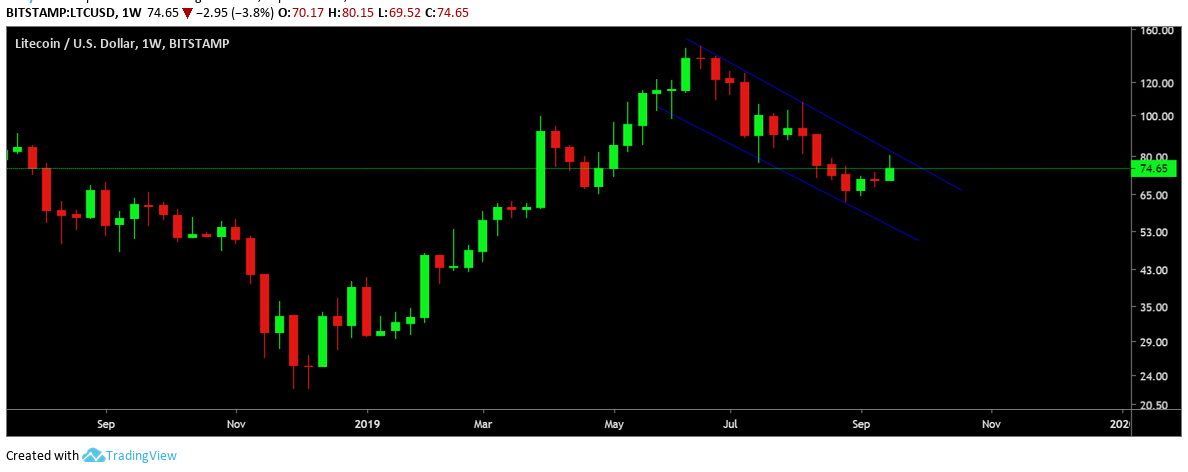
Source: TradingView
The above weekly chart for Litecoin exhibited a descending channel with the price trend leading to a parallel channel tilted downward. This further predicted an upward price breakout.
Conclusion:
The above long-term charts for the coin continued to remain positive and a potential bull run for the coin could potentially shoot its prices to $96. However, in a scenario of a bear phase and a reversal in the current positive trend, Litecoin could find its support at $57.