
With a bullish sentiment reaffirmed by EOS’s technical indicators, the altcoin was on its way to breach a key resistance level over the next few trading sessions.
IOTA traders speculated the rise of bullish sentiment, but a weakening buying sentiment could soon cause a trend reversal for the altcoin. FTX token, on the other hand, was poised for further gains and remained bullish.
EOS
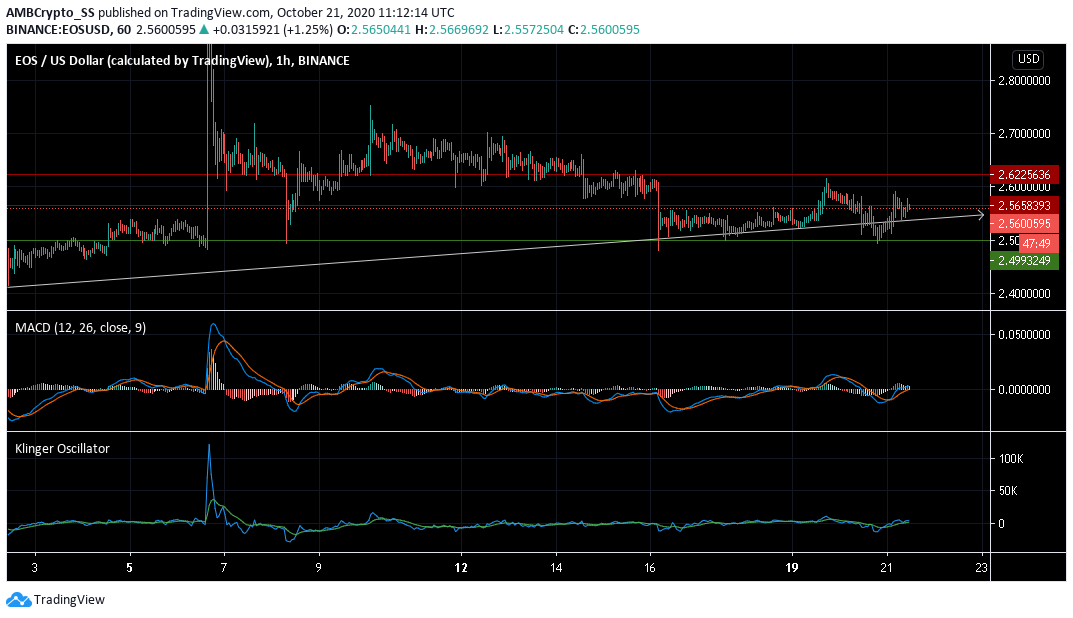
Source: EOS/USD on TradingView
EOS seemed to gather good buying momentum as it prolonged its price recovery journey. The bulls managed to push the prices above the $2.499 level of support over the last 24 hours.
The MACD line took over the signal line and formed a bullish crossover. The Klinger Oscillator also followed suit and displayed the presence of a buying sentiment into the EOS market, with its bullish crossover.
With the bulls capturing the $2.56 resistance level, a move above this level remains a likely scenario over the next few days.
IOTA
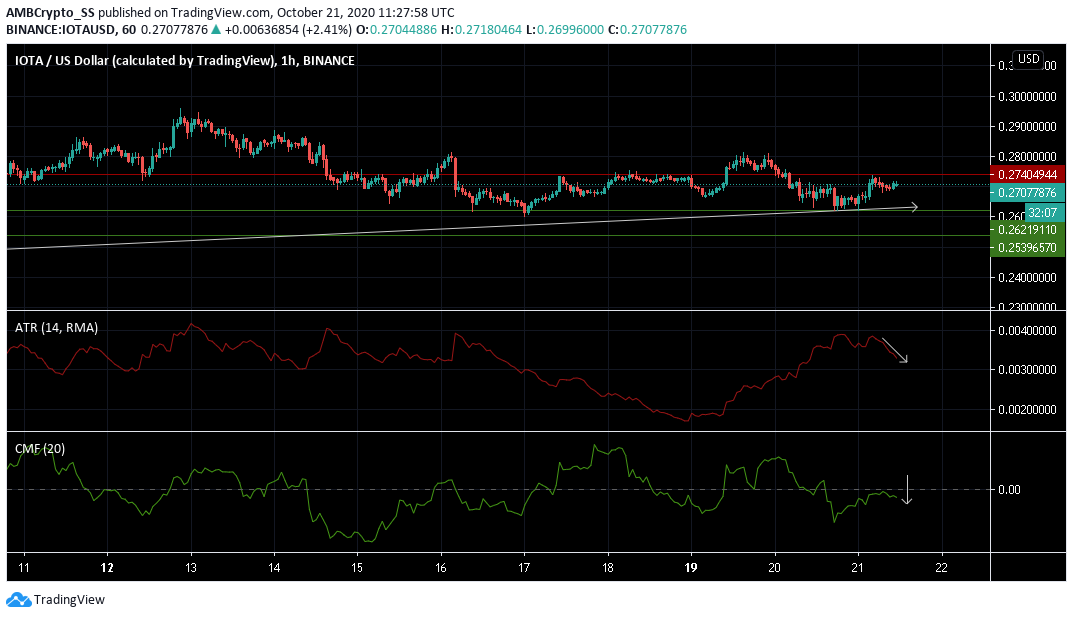
Source: IOTA/USD on TradingView
IOTA at the time of writing was trading close to its resistance level at $0.274. It recorded a price gain of almost 2% over the past 24-hours.
Despite this at press time, IOTA signaled a downtrend as it failed to gain control over its immediate resistance level. Average True Range, used to measure market volatility was in a downtrend, making lower highs and signaling a dip in IOTA’s volatility level.
Chaikin Money Flow was below the zero line, suggesting capital outflows were greater than capital inflows, and painted a bearish outlook for the price movement as it pointed southwards.
Given this scenario, if bulls fail to gather control at the immediate resistance level, a trend reversal to bearish could be witnessed in the IOTA market soon.
FTX Token [FTT]
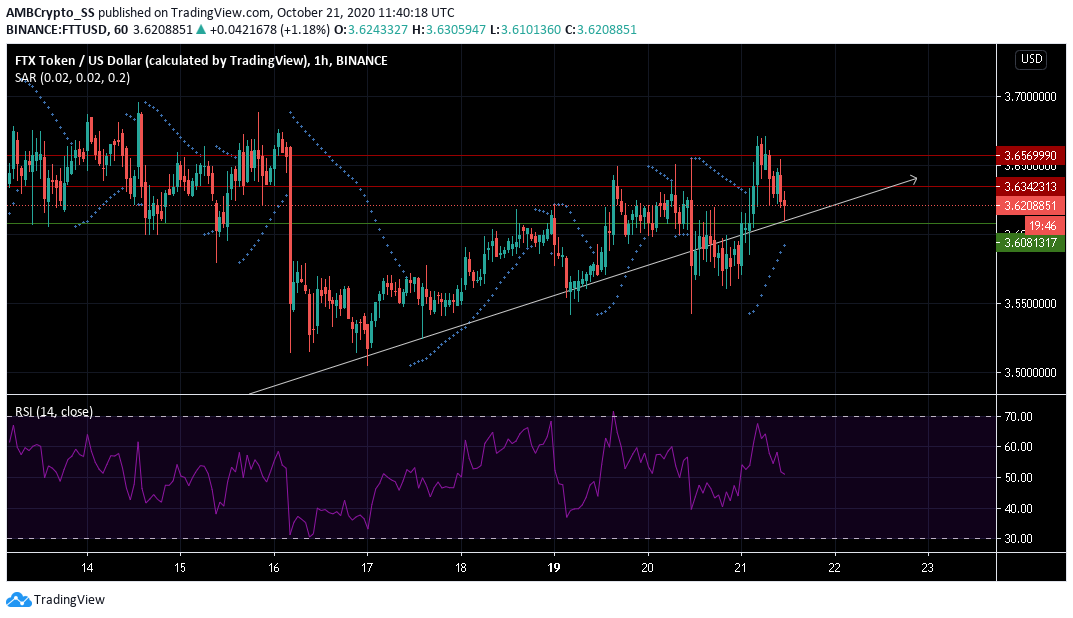
Source: FTT/USD on TradingView
FTT the native coin of the FTX ecosystem, over the last 24 hours, was up by almost a percent and its LTP was $3.620
Hovering just above its support level, the digital asset nevertheless displayed a strong uptrend over the last couple of days, as FTT bulls managed to push prices further up.
The uptrend was at press time witnessing a minor reversal, as the Relative Strength Index (RSI) dove towards the 50-neutral level. This also coincided with the recent price dump as prices fell from the $ 3.656 level of resistance.
However the dotted lines of the Parabolic SAR below the candles seemed to not support the crypto currency’s recent sell-off, and with FTT’s overall uptrend, a move above the $3.608 support may be expected.